Difference between revisions of "TOI processing"
| Line 24: | Line 24: | ||
== Examples of clean TOIs == | == Examples of clean TOIs == | ||
TBD: raw TOIs plot | TBD: raw TOIs plot | ||
| − | |||
<gallery widths=300px perrow=3> | <gallery widths=300px perrow=3> | ||
| Line 30: | Line 29: | ||
File:10_143_5_rcircles_LFER4_JC.jpg| Valid signal (up) and noise (bottom) for 2 consecutive circles of the ring 4000 | File:10_143_5_rcircles_LFER4_JC.jpg| Valid signal (up) and noise (bottom) for 2 consecutive circles of the ring 4000 | ||
File:10_143_5_fft_LFER4_JC.jpg| Fourier power spectral density of the first 30 minutes of the ring 4005 with signal before (pink) and after (black) deconvolution (top) and noise (bottom) | File:10_143_5_fft_LFER4_JC.jpg| Fourier power spectral density of the first 30 minutes of the ring 4005 with signal before (pink) and after (black) deconvolution (top) and noise (bottom) | ||
| + | File:14_545_1_PBR_10800RING_LFER4_JC.jpg|Phase-binned signal (PBR) for 6 consecutive rings from 4000 to 4005 | ||
| + | File:14_545_1_rcircles_LFER4_JC.jpg| Valid signal (up) and noise (bottom) for 2 consecutive circles of the ring 4000 | ||
| + | File:14_545_1_fft_LFER4_JC.jpg| Fourier power spectral density of the first 30 minutes of the ring 4005 with signal before (pink) and after (black) deconvolution (top) and noise (bottom) | ||
</gallery> | </gallery> | ||
| − | + | [[File:check_ring.pdf|All detectors are shown in this file]] | |
| − | |||
| − | |||
| − | |||
| − | |||
| − | |||
Revision as of 13:17, 19 October 2012
This Section is kept short as this Planck release does not contain TOIs. The main information in the HFI processing paper is not duplicated here.
Contents
Overview[edit]
We describe here the how the TOIs are processed in order to be used for map production. We do not repeat the general features of the pipeline which are given in the HFI Data Processing article (REF). Here we give complementary explanations on some details. The TOI of each bolometer is processed independently of the other bolometers, so as to keep the noise properties as uncorrelated as possible. The processing involves modifying the TOI itself for what concerns the conversion to absorbed power and the correction of glitch tails. It also adds a flag TOI that masks the TOI samples that are not to be projected on maps for various reasons.
Input TOI[edit]
The input TOI consists in the AC modulated voltage output of the readout of each bolometer. The input has previously been decompressed, and converted from internal digital units to voltage via a constant factor. The TOI has a regular sampling at the acquisition frequency of facq=180.373700+-0.000050 Hz. There are almost no missing data in the TOIs, except for few hundred samples of 545 and 857GHz TOIs which are lost in the on-board compression due to saturation on the Galactic Center crossings.
General Pipeline Structure[edit]
The next figure shows how the initial ccTOI is transformed and how flags are produced:

Output TOIs and products[edit]
A TOI of clean calibrated samples (ccTOI) and a combined flag TOI (fTOI) are the outputs of the processing. The ccTOI is calibrated so as to represent the instantaneous power absorbed by the detector. It is worth mentioning how the ccTOI is changed with respect to the input TOI, beyond the harmless constant conversion factor from voltage to absorbed power. The demodulation stage allows to get the demodulated bolometer voltage. The non-linearity correction is a second-order polynomial correction based on the physical but static bolometer model. In order to avoid too much masking after glitches, a glitch tail is subtracted after an occurrence of a glitch in the TOI. Finally, the temporal response of the bolometer is deconvolved. This affects mostly the high-temporal frequency part of the TOI, although a small but significant low frequency tail is corrected too. Although flagged samples are not projected, their value influences the valid samples somehow. Hence interpolation procedures introduce some indirect modifications of the TOI. The flag TOI is a combination a dozen flags with an OR logic. Only unflagged data are projected. The exhaustive list of flags is given here: CompressionError, NoData, SSO, UnstablePointing, Glitch, BoloPlateFluctuation, RTS, Jump, PSBab. A complete qualification of the data is obtained at the ring level. If the TOI shows an anomalous behaviour during the duration of a ring, this ring is discarded from projection.
Examples of clean TOIs[edit]
TBD: raw TOIs plot
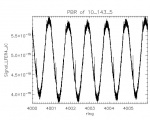
Phase-binned signal (PBR) for 6 consecutive rings from 4000 to 4005
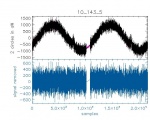
Valid signal (up) and noise (bottom) for 2 consecutive circles of the ring 4000
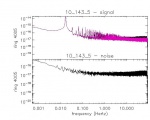
Fourier power spectral density of the first 30 minutes of the ring 4005 with signal before (pink) and after (black) deconvolution (top) and noise (bottom)
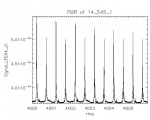
Phase-binned signal (PBR) for 6 consecutive rings from 4000 to 4005
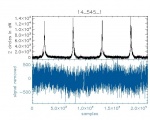
Valid signal (up) and noise (bottom) for 2 consecutive circles of the ring 4000
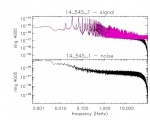
Fourier power spectral density of the first 30 minutes of the ring 4005 with signal before (pink) and after (black) deconvolution (top) and noise (bottom)


Signal (top) and noise (bottom) smoothed at 1 minute. All values falling in a
discarded ring are not plotted.
Trends in the output processing variables[edit]
Here we intend to show the trend of the systematic effects that are dealt with in the TOI processing
Glitch statistics[edit]

Glitch rate vs. time is shown in the Figure. Otherwise see copap. TBD : Fig. percentage of flagged data per bolometer (mostly due to CR).
Thermal template for decorrelation[edit]

A simple linear decorrelation is performed using the 2 dark bolometers as a proxy of the bolometer plate temperature. Coupling coefficients were measured during the CPV phase.
4K cooler lines variability[edit]
TBD: Figure 9 coefficients amplitudes, one page per bolo Mark interpolated rings.
jump correction[edit]
Trends in noise and signal[edit]
TBD: ADC baseline (one sample per hour) per bolometer TBD: Smooth over the whole mission (1min per sample) on valid rings.
Noise stationarity[edit]
Noise power spectrum: examples (Andrea)
rms per ring corrected by ring duration bias: One per bolo, only valid rings, Smoothed version.

Flag description[edit]
Input flags[edit]
These flags are used as inputs to the TOI processing
- The point-source flag (PSflag):
An earlier version of HFI point-source catalog is read back into a flag TOIs, at a given frequency. In practice, 5 sigma sources are masked within a radius of 1.3 FWHM
- the galactic flag (Galflag):
An earlier version of HFI maps is thresholded and apodized. The produced masks are read into flag TOIs. The retained threshold corresponds to a sky coverage of respectively 90, 90, 90, 80, 70, 70% at 100,143,217,353,545,857 GHz (TBC????)
- Solar System Object flag (SSO flag)
4 toi, 4map, seen beam FWHM = 9,7,5,5,5,5 a 100,143,217,353,545,857 GHz
TOI : Mars, Jupiter, Saturn flagges a 2,3,3,4,4,4 FWHM
MAP : Mars, Jupiter, Saturn flagges a Factor_Source x NbBeam_freq FWHM avec Factor_per_Source1 = 1.1 (Mars) Factor_per_Source2 = 2.25 (Jupiter) Factor_per_Source3 = 1.25 (Saturn) NbBeam2Flag_list1 = 2.25 100 GHz NbBeam2Flag_list2 = 4.25 NbBeam2Flag_list3 = 4.0 NbBeam2Flag_list4 = 5.0 NbBeam2Flag_list5 = 6.0 857 GHz
en plus une petite queue pour prendre en compte la non deconvolution du signal de la planete interpolee par le signal "de fond" largeur = 10 % du diametre du flag principal Nb de SN flaggues en plus du flag principal = Factor_Source x AddSNafter1 AddSNafter1 = 10 100 GHz AddSNafter2 = 30 AddSNafter3 = 20 AddSNafter4 = 20 AddSNafter5 = 30 AddSNafter6 = 40 857 GHz
seen :
Output flags[edit]
with and without point-sources, identical to a and b PSBs.
Flags produced for the map making :
   UnstablePointing Flag OR FlagTOIproc OR SSOflag 4 map OR SSOflag seen
   FlagTOIproc = glitch OR jump OR flag thermal template
If PSB flag glitch = flag glitch A OR flag glitch B
Flag used in the destriping: same + point-source flag
output TOI description[edit]
| Essai1 | Essai2 |
(Planck) High Frequency Instrument
Solar System Object
random telegraphic signal
To be defined / determined
Calibration and Performance Verification
sudden change of the baseline level inside a ring
analog to digital converter
Full-Width-at-Half-Maximum
To be confirmed