Difference between revisions of "Foreground maps"
(→Previous Releases: (2015) and (2013) Foreground Maps) |
(→Previous Releases: (2015) and (2013) Foreground Maps) |
||
| Line 2,053: | Line 2,053: | ||
|} | |} | ||
| + | ''' Lensing map ''' | ||
| + | |||
| + | Here we present the minimum-variance (MV) lens reconstruction which forms the basis for the main results of {{PlanckPapers|planck2013-p12}}. This map is produced using a combination of the 143 and 217 GHz Planck maps on approximately 70% of the sky, and is the same map on which the Planck lensing likelihood is based. | ||
| + | |||
| + | We distribute: | ||
| + | |||
| + | ; PHIBAR : A (transfer-function convolved) map of the lensing potential, in NSIDE 2048 HEALPix RING format. It is obtained by convolving the lensing potential estimate <math>\hat{\phi}</math> with the lensing response function <math>R_L^{\phi\phi}</math>. This map has been band-limited between multipoles <math>10 \le L \le 2048</math>. | ||
| + | ; MASK : This is a NSIDE = 2048 HEALPix map, containing the analysis mask used in the lens reconstruction. ''Note'': the lensing map PHIBAR may take small but non-zero values inside the masked regions because it has been bandlimited. | ||
| + | ; RLPP : This column contains the response function <math>R_L^{\phi\phi}</math>. | ||
| + | ; NLPP : This column contains a sky-averaged estimate of the noise power spectrum of PHIBAR, <math>N_L^{\phi\phi}</math>. The noise is highly coloured. There is a dependence of the noise power spectrum on the local noise level of the map, discussed in Appendix A of {{PlanckPapers|planck2013-p12}}. Note that the noise power spectrum estimate here is not sufficiently accurate for a power spectrum analysis. | ||
| + | |||
| + | Also, the table below gives the lensing curl-mode power spectrum data used to produce Figure A2 of {{PlanckPapers|planck2013-p12}}: | ||
| + | |||
| + | {| border="1" cellpadding="3" cellspacing="0" align="center" style="text-align:center" | ||
| + | |+ ''''MV' curl reconstruction bandpowers from Fig A2 of {{PlanckPapers|planck2013-p12}} ''' | ||
| + | |- bgcolor="ffdead" | ||
| + | ! <math>L</math><sub>min</sub> || <math>L</math><sub>max</sub> || <math>{\hat{C}_L}^{\psi\psi} (L(L+1))^2/(2\pi)</math> || <math> std({\hat{C}_L}^{\psi\psi}) (L(L+1))^2 /(2\pi)</math> | ||
| + | |- | ||
| + | | 2 || 7 || -13.6379 || 15.3409 | ||
| + | |- | ||
| + | | 8 || 20 || 6.0184 || 4.8881 | ||
| + | |- | ||
| + | | 21 || 39 || -1.0675 || 3.0940 | ||
| + | |- | ||
| + | | 40 || 65 || 0.6135 || 1.8474 | ||
| + | |- | ||
| + | | 66 || 100 || 1.5030 || 1.2696 | ||
| + | |- | ||
| + | | 101 || 144 || 1.3760 || 0.9950 | ||
| + | |- | ||
| + | | 145 || 198 || -1.2289 || 0.8286 | ||
| + | |- | ||
| + | | 199 || 263 || 1.1910 || 0.7001 | ||
| + | |- | ||
| + | | 264 || 338 || -0.6567 || 0.6197 | ||
| + | |- | ||
| + | | 339 || 425 || -0.8201 || 0.5235 | ||
| + | |- | ||
| + | | 426 || 525 || -0.7581 || 0.4850 | ||
| + | |- | ||
| + | | 526 || 637 || -0.3201 || 0.5134 | ||
| + | |- | ||
| + | | 638 || 762 || -0.1589 || 0.4073 | ||
| + | |- | ||
| + | | 763 || 901 || -0.6451 || 0.4044 | ||
| + | |- | ||
| + | | 902 || 1054 || 0.4910 || 0.3718 | ||
| + | |- | ||
| + | | 1055 || 1221 || -0.2186 || 0.3702 | ||
| + | |- | ||
| + | | 1222 || 1404 || -0.3295 || 0.4146 | ||
| + | |- | ||
| + | | 1405 || 1602 || -0.3647 || 0.4703 | ||
| + | |- | ||
| + | | 1603 || 1816 || -0.1060 || 0.5904 | ||
| + | |- | ||
| + | | 1817 || 2020 || -0.7887 || 0.8507 | ||
| + | |} | ||
| + | |||
| + | |||
| + | ''' Production process ''' | ||
| + | |||
| + | The construction PHIBAR, RLPP and NLPP are described in detail in Sec. 2.1 of {{PlanckPapers|planck2013-p12}}. The response function <math>R_L^{\phi\phi}</math> here is analogous to the the beam transfer function in a CMB temperature or polarization map. We have chosen to distribute this transfer-function convolved map rather than the normalized lens reconstruction as it is a significantly more localized function of the CMB temperature map from which it is derived, and therefore more useful for cross-correlation studies. | ||
| + | |||
| + | '''Inputs''' | ||
| + | |||
| + | This product is built from the 143 and 217 GHz Planck [[Frequency Maps|frequency maps]], with 857GHz projected out as a dust template. | ||
| + | The analysis mask is constructed from a combination of thresholding in the 857GHz map (to remove the regions which are most contaminated by Galactic dust) and the [[CMB_and_astrophysical_component_maps#CO_emission_maps | Type2 CO map]] (to reduce contamination from CO lines at 217GHz). This is joined with a compact object mask synthesized from several Planck source [[Catalogues | catalogues]], including the [[ Catalogues#ERCSC | ERCSC]], [[ Catalogues#SZ | SZ ]] and [[ Catalogues#The Catalogue of Compact Sources | PCCS ]]. The reconstruction was performed using the fiducial beam window functions B(l) from the [[ The RIMO | HFI RIMO ]]. Details of the procedure used to produce a lensing estimate from these inputs are given in {{PlanckPapers|planck2013-p12}}. | ||
| + | |||
| + | '''File names and format''' | ||
| + | |||
| + | A single file named | ||
| + | *''{{PLASingleFile|fileType=map|name=COM_CompMap_Lensing_2048_R1.10.fits|link=COM_CompMap_Lensing_2048_R1.10.fits}}'' | ||
| + | with two BINTABLE extensions containing the items described below. | ||
| + | |||
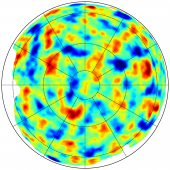
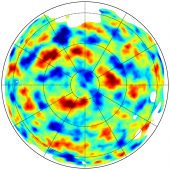
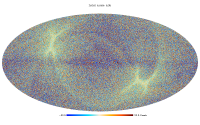
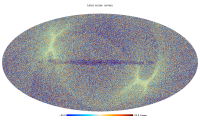
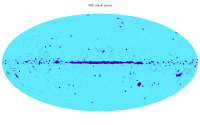
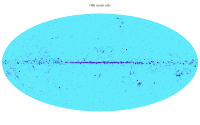
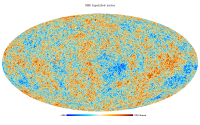
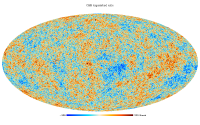
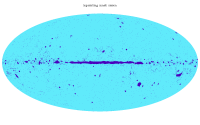
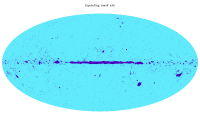
| + | For illustration, we show in the figures below the maps of the Wiener-filtered CMB lensing potential in Galactic coordinates using orthographic projection. The reconstruction was bandpass filtered to <math>L \in [10, 2048]</math>. Note that the lensing reconstruction, while highly statistically significant, is still noise dominated for every individual mode, and is at best <math>S/N \simeq 0.7</math> around <math>L = 30</math>. | ||
| + | |||
| + | <center> | ||
| + | <gallery perrow=3 widths=260px heights=170px> | ||
| + | File: analysis_lens_pub_map_orth_north_dat_p.png | Galactic north | ||
| + | File: analysis_lens_pub_map_orth_south_dat_p.png | Galactic south | ||
| + | </gallery></center> | ||
| + | |||
| + | |||
| + | |||
| + | {| border="1" cellpadding="3" cellspacing="0" align="center" style="text-align:left" | ||
| + | |+ '''FITS file structure''' | ||
| + | |- bgcolor="ffdead" | ||
| + | !colspan="4" | 1. EXTNAME = ''LENS-MAP'' | ||
| + | |- bgcolor="ffdead" | ||
| + | ! Column Name || Data Type || Units || Description | ||
| + | |- | ||
| + | |PHIBAR || Real*4 || none || Map of the lensing potential estimate, convolved with RLPP | ||
| + | |- | ||
| + | |MASK || Int || none || Region over which the lensing potential is reconstructed | ||
| + | |- bgcolor="ffdead" | ||
| + | ! Keyword || Data Type || Value || Description | ||
| + | |- | ||
| + | |PIXTYPE || string || HEALPIX || colspan="2"| | ||
| + | |- | ||
| + | |COORDSYS || string || GALACTIC || Coordinate system | ||
| + | |- | ||
| + | |ORDERING || string || NESTED || Healpix ordering | ||
| + | |- | ||
| + | |NSIDE || Int*4 || 2048 ||colspan="2"| Healpix Nside | ||
| + | |- | ||
| + | |FIRSTPIX || Int*4 || 0 || | ||
| + | |- | ||
| + | |LASTPIX || Int*4 || 50331647 || | ||
| + | |- bgcolor="ffdead" | ||
| + | !colspan="4"| 2. EXTNAME = ''TransFun'' | ||
| + | |- bgcolor="ffdead" | ||
| + | ! Column Name || Data Type || Units || Description | ||
| + | |- | ||
| + | |RLPP || Real*4 || none || Response function | ||
| + | |- | ||
| + | |NLPP || Real*4 || none || Sky-averaged noise power spectrum estimate | ||
| + | |- bgcolor="ffdead" | ||
| + | ! Keyword || Data Type || Value || Description | ||
| + | |- | ||
| + | |L_MIN || Int*4 || 0 || First multipole | ||
| + | |- | ||
| + | |L_MAX || Int*4 || 2048 || Last multipole | ||
| + | |} | ||
</div> | </div> | ||
Revision as of 13:56, 10 July 2018
Contents
[hide]Astrophysical Components[edit]
Overview[edit]
This section describes the maps of astrophysical components produced from the Planck data. These products are derived from some or all of the nine frequency channel maps described above using different techniques and, in some cases, using other constraints from external data sets. Here we give a brief description of each product and how it is obtained, followed by a description of the FITS file containing the data and associated information. All the details can be found in Planck-2020-A4[1] and Planck-2020-A8[2].
Commander-derived astrophysical foreground maps[edit]
As discussed in detail in Planck-2020-A4[1], the main Planck 2018 frequency sky maps have significantly lower systematic errors than earlier versions. At the same time, these maps are also associated with a significant limitation, in that no robust single detector or detector set maps are available. As described in Planck-2020-A3[3], such maps do not contain the full signal content of the true sky. As a result, only full frequency maps are distributed and used in the 2018 analysis.
For polarization analysis, this is not a significant issue, and the 2018 polarization foreground products therefore supersede the 2015 release in all respects. However, for temperature analysis the lack of single-detector maps strongly limits the ability to extract CO line emission from the data set, and it is also not possible to exclude known detector outliers; see Planck-2015-A10[4] for details. For these reasons, we consider the parametric foreground products from 2015 to represent a more accurate description of the true sky than the corresponding 2018 version. As a result, we do not release parametric temperature foreground products from the 2018 data set, but rather recommend continued usage of the 2015 temperature model. For polarization, we recommend usage of the 2018 model.
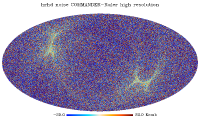
Two Commander-based polarization foreground products are provided for the Planck 2018 releaes, namely synchrotron and thermal dust emission. For synchrotron emission, a spatially constant spectral index of β=-3.1 is adopted. For thermal dust emission, the dust temperature is fixed to that derived from the corresponding 2018 intensity analysis, while the spectral index is fitted directly from the polarization measurements, smoothed to 3 degrees FWHM. For both synchrotron and thermal dust emission, we provide results derived from both the full-mission data set, and from the half-mission and odd-even splits.
In addition to the real observations, we also provide 300 end-to-end noise simulations processed through the algorithm with the same spectral parameters as derived from the data for each of the data splits. The filenames of these simulations have the following format:
- dx12_v3_commander_{synch,dust}_noise_{full,hm1,hm2,oe1,oe2}_00???_raw.fits
Inputs[edit]
The following data products are used for the full-mission polarization analysis (corresponding data are used for the data split products):
- Full-mission 30 GHz frequency map, LFI 30 GHz frequency maps
- Full-mission 44 GHz frequency map, LFI 44 GHz frequency maps
- Full-mission 70 GHz frequency map, LFI 70 GHz frequency maps
- Full-mission 100 GHz frequency map, HFI 100 GHz frequency maps
- Full-mission 143 GHz frequency map, HFI 143 GHz frequency maps
- Full-mission 217 GHz frequency map, HFI 217 GHz frequency maps
- Full-mission 353 GHz frequency map, HFI 353 GHz frequency maps
Outputs[edit]
Synchrotron emission[edit]
- Full-mission file name: COM_CompMap_QU_synchrotron-commander_2048_R3.00_full.fits
- First half-mission split file name: COM_CompMap_QU_synchrotron-commander_2048_R3.00_hm1.fits
- Second half-mission split file name: COM_CompMap_QU_synchrotron-commander_2048_R3.00_hm2.fits
- Odd ring split file name: COM_CompMap_QU_synchrotron-commander_2048_R3.00_oe1.fits
- Even ring split file name: COM_CompMap_QU_synchrotron-commander_2048_R3.00_oe2.fits
- Nside = 2048
- Angular resolution = 40 arcmin
- Reference frequency: 30 GHz
| Column Name | Data Type | Units | Description |
|---|---|---|---|
| Q_STOKES | Real*4 | μK_RJ | Stokes Q posterior maximum |
| U_STOKES | Real*4 | μK_RJ | Stokes U posterior maximum |
Thermal dust emission[edit]
- Full-mission file name: COM_CompMap_QU_synchrotron-commander_2048_R3.00_full.fits
- First half-mission split file name: COM_CompMap_QU_synchrotron-commander_2048_R3.00_hm1.fits
- Second half-mission split file name: COM_CompMap_QU_synchrotron-commander_2048_R3.00_hm2.fits
- Odd ring split file name: COM_CompMap_QU_synchrotron-commander_2048_R3.00_oe1.fits
- Even ring split file name: COM_CompMap_QU_synchrotron-commander_2048_R3.00_oe2.fits
- Nside = 2048
- Angular resolution = 5 arcmin
- Reference frequency: 353 GHz
| Column Name | Data Type | Units | Description |
|---|---|---|---|
| Q_STOKES | Real*4 | uK_RJ | Full-mission Stokes Q posterior maximum |
| U_STOKES | Real*4 | uK_RJ | Full-mission Stokes U posterior maximum |
SMICA-derived astrophysical foreground maps[edit]
Two SMICA-based polarization foreground products are provided, namely synchrotron and thermal dust emission. These are derived using the usual SMICA spectral matching method, tuned specifically for the reconstruction of two polarized foregrounds. Specifically, three coherent components (plus noise) are fitted at the spectral level with the first one constrained to have CMB emissivity. No assumptions are made regarding the other two components: they are not assumed to have a specific emissivity or angular spectrum, nor are they assumed to be uncorrelated. This leaves a degenerate model but that degeneracy can be entirely fixed after the spectral fit by assuming that synchrotron emission is negligible at 353 GHz and that thermal dust emission is negligible at 30 GHz. For both synchrotron and thermal dust emission, we provide results derived from both the full-mission data set, and from the half-mission and odd-even splits.
In addition to the real observations, we also provide 300 end-to-end noise simulations processed through the algorithm with the same spectral parameters as derived from the data for each of the data splits. The filenames of these simulations have the following format:
- dx12_v3_smica_{synch,dust}_noise_{full,hm1,hm2,oe1,oe2}_00???_raw.fits
Inputs[edit]
The following data products are used for the full-mission polarization analysis (corresponding data are used for the data split products):
- Full-mission 30 GHz frequency map, LFI 30 GHz frequency maps
- Full-mission 44 GHz frequency map, LFI 44 GHz frequency maps
- Full-mission 70 GHz frequency map, LFI 70 GHz frequency maps
- Full-mission 100 GHz frequency map, HFI 100 GHz frequency maps
- Full-mission 143 GHz frequency map, HFI 143 GHz frequency maps
- Full-mission 217 GHz frequency map, HFI 217 GHz frequency maps
- Full-mission 353 GHz frequency map, HFI 353 GHz frequency maps
Outputs[edit]
Synchrotron emission[edit]
- Full-mission file name: COM_CompMap_QU_synchrotron-smica_2048_R3.00_full.fits
- First half-mission split file name: COM_CompMap_QU_synchrotron-smica_2048_R3.00_hm1.fits
- Second half-mission split file name: COM_CompMap_QU_synchrotron-smica_2048_R3.00_hm2.fits
- Odd ring split file name: COM_CompMap_QU_synchrotron-smica_2048_R3.00_oe1.fits
- Even ring split file name: COM_CompMap_QU_synchrotron-smica_2048_R3.00_oe2.fits
- Nside = 2048
- Angular resolution = 40 arcmin
- Reference frequency: Integrated 30 GHz band; no colour corrections have been applied
| Column Name | Data Type | Units | Description |
|---|---|---|---|
| Q_STOKES | Real*4 | mK_RJ | Stokes Q posterior maximum |
| U_STOKES | Real*4 | mK_RJ | Stokes U posterior maximum |
Thermal dust emission[edit]
- Full-mission file name: COM_CompMap_QU_thermaldust-smica_2048_R3.00_full.fits
- First half-mission split file name: COM_CompMap_QU_thermaldust-smica_2048_R3.00_hm1.fits
- Second half-mission split file name: COM_CompMap_QU_thermaldust-smica_2048_R3.00_hm2.fits
- Odd ring split file name: COM_CompMap_QU_thermaldust-smica_2048_R3.00_oe1.fits
- Even ring split file name: COM_CompMap_QU_thermaldust-smica_2048_R3.00_oe2.fits
- Nside = 2048
- Angular resolution = 12 arcmin
- Reference frequency: Integrated 353 GHz band; no colour corrections have been applied
| Column Name | Data Type | Units | Description |
|---|---|---|---|
| Q_STOKES | Real*4 | mK_RJ | Full-mission Stokes Q posterior maximum |
| U_STOKES | Real*4 | mK_RJ | Full-mission Stokes U posterior maximum |
GNILC thermal dust maps[edit]
The 2018 GNILC thermal dust products are provided as single files that include both intensity and polarization, 3x3 IQU noise covariance matrices per pixel, and as well as local smoothing scale for the variable resolution map. The structure of the data files is the following:
- Uniform resolution file name: COM_CompMap_IQU_thermaldust-gnilc-unires_2048_R3.00.fits
- Variable resolution file name: COM_CompMap_IQU_thermaldust-gnilc-varres_2048_R3.00.fits
- Nside = 2048
- Angular resolution = 80 arcmin FWHM, or variable
- Reference frequency: Integrated 353 GHz band; no colour corrections have been applied
| Column Name | Data Type | Units | Description |
|---|---|---|---|
| I_STOKES | Real*4 | K_cmb | Stokes I estimate |
| Q_STOKES | Real*4 | K_cmb | Stokes Q estimate |
| U_STOKES | Real*4 | K_cmb | Stokes U estimate |
| II_COV | Real*4 | K_cmb^2 | Covariance matrix II element |
| IQ_COV | Real*4 | K_cmb^2 | Covariance matrix IQ element |
| IU_COV | Real*4 | K_cmb^2 | Covariance matrix IU element |
| QQ_COV | Real*4 | K_cmb^2 | Covariance matrix QQ element |
| QU_COV | Real*4 | K_cmb^2 | Covariance matrix QU element |
| UU_COV | Real*4 | K_cmb^2 | Covariance matrix UU element |
| FWHM | Real*4 | arcmin | Local FWHM smoothing scale |
Other maps that require special processing[edit]
2015 Lensing map[edit]
We distribute the minimum-variance (MV) lensing potential estimate presented in Planck-2015-A15[5] as part of the 2014 data release. This map represents an estimate of the CMB lensing potential on approximately 70% of the sky, and also forms the basis for the Planck 2014 lensing likelihood. It is produced using filtered temperature and polarization data from the SMICA DX11 CMB map; its construction is discussed in detail in Planck-2015-A09[6].
The estimate is contained in a single gzipped tarball named COM_CompMap_Lensing_2048_R2.00.tgz. Its contents are described below. The convergence map "dat_klm.fits" that can be found in the tarball, has been categorized as COM_Lensing-Convergence-dat-klm_2048_R2.00.fits in the Lensing Products section of the archive.
| Filename | Format | Description |
|---|---|---|
| dat_klm.fits | HEALPix FITS format alm, with | Contains the estimated lensing convergence . |
| mask.fits.gz | HEALPix FITS format map, with | Contains the lens reconstruction analysis mask. |
| nlkk.dat | ASCII text file, with columns = (, , ) | The approximate noise (and signal+noise, ) power spectrum of , for the fiducial cosmology used in Planck-2015-A13[7]. |
Previous Releases: (2013) Lensing Maps[edit]
2013 Release of the lensing map
2015 Lensing-induced B-mode map[edit]
We distribute the Planck map of the lensing-induced B-modes presented in Planck-2015-XLI[9]. The Stokes parameter maps of the lensing B-modes are produced by combining the lensing potential map extracted from the SMICA CMB temperature map with E-mode data from the SMICA CMB polarization maps. The SMICA temperature and polarization products are described in Planck-2015-A09[6]. The lensing-induced B-mode polarization maps are used in cross-correlation with the SMICA CMB polarization maps to obtain a lensing B-mode power spectrum measurement from approximately 70% of the sky.
We provide both raw products, which can be utilized to generate products adapted to one's specific needs in term of mask, filtering, etc., and "ready-to-use" products for cross-correlation study purposes.
Raw products[edit]
We deliver the non-normalized lensing-induced Stokes parameter maps, labelled and , which form the basis of the final lensing B-mode estimator defined in equation (6) of the paper. They are defined as
where and are the filtered pure E-mode polarization maps given in equation (5), and is the filtered lensing potential estimate.
We also provide the normalization transfer function defined in equation (12), as well as the "B70" mask that retains 69% of the sky before apodization, and its apodized version , which has an effective sky fraction .
As an example of the utilization of these products, the lensing B-mode maps that are shown in figure 4 are generated from
,
where is a Gaussian filter of 60 arcmin FWHM (introduced for highlighting large angular scales, although it can be removed or replaced by any other filter). This can be practically done by ingesting and in the HEALPix "smoothing" routine, and using the product as an input filtering function.
The lensing-induced Stokes parameter maps are provided without being masked for the user's convenience (in particular, it allows for various filtering to be tested). However, whenever they are utilized in view of obtaining scientific outcomes, they should be masked using the B70 mask, which is also provided.
Specific products[edit]
We provide the lensing B-mode spherical harmonic coefficient estimate over approximately 70% of the sky.
It can also be constructed using the raw products described above from
,
where is a band-pass filter that retain the multipole range , and is a short-hand notation for transforming a map into spin-weighted spherical harmonic coefficients , and forming . This can be done using, e.g., the HEALPix "anafast" tool.
The lensing B-mode power spectrum estimate is obtained by forming the cross-correlation power spectrum of and the B-mode data from the SMICA polarization maps :
,
where is the 5 arcmin Gaussian beam that convolves the SMICA CMB maps.
The products are contained in a single gzipped tarball named COM_Lensing-Bmode_R2.01.tgz. Its contents are described below.
| Filename | Format | Description |
|---|---|---|
| bar_q_lens_map.fits | HEALPix FITS format map in Galactic coordinates with | Contains the non-normalized lensing-induced Q Stokes parameter map . |
| bar_u_lens_map.fits | HEALPix FITS format map in Galactic coordinates with | Contains the non-normalized lensing-induced U Stokes parameter map . |
| mask.fits | HEALPix FITS format map in Galactic coordinates with | The B70 mask (apodized version). |
| mask_noapo.fits | HEALPix FITS format map in Galactic coordinates with | The B70 mask without apodization. |
| transfer_function_b_l.dat | ASCII text file, with columns = (, ) | The transfer function of the lensing B-mode estimator. |
| lensing_bmode_b_lm.fits | HEALPix FITS format alm, with | Contains the lensing B-mode harmonic coefficients . |
| lensing_bmode_bandpowers.dat | ASCII text file, with columns = (, , , , ) | The lensing B-mode bandpower estimate on approximativily 70% of the sky and over the multipole range from 10 to 2000 shown in figure 10 of Planck-2015-XLI[9] (for plotting purposes only). |
Previous Releases: (2015) and (2013) Foreground Maps[edit]
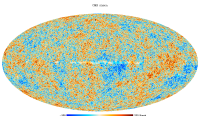
Astrophysical components based on the 2015 data release
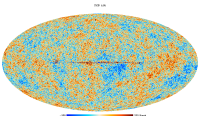
Astrophysical components based on the 2013 data release
References[edit]
- ↑ Jump up to: 1.01.1 Planck 2018 results. IV. Diffuse component separation, Planck Collaboration, 2020, A&A, 641, A4.
- Jump up ↑ Planck 2018 results. VIII. Lensing, Planck Collaboration, 2020, A&A, 641, A8.
- Jump up ↑ Planck 2018 results. III. High Frequency Instrument data processing and frequency maps, Planck Collaboration, 2020, A&A, 641, A3.
- ↑ Jump up to: 4.04.14.2 Planck 2015 results. X. Diffuse component separation: Foreground maps, Planck Collaboration, 2016, A&A, 594, A10.
- ↑ Jump up to: 5.05.1 Planck 2015 results. XV. Gravitational Lensing, Planck Collaboration, 2016, A&A, 594, A15.
- ↑ Jump up to: 6.06.16.26.3 Planck 2015 results. XI. Diffuse component separation: CMB maps, Planck Collaboration, 2016, A&A, 594, A9.
- ↑ Jump up to: 7.07.1 Planck 2015 results. XIII. Cosmological parameters, Planck Collaboration, 2016, A&A, 594, A13.
- ↑ Jump up to: 8.008.018.028.038.048.058.068.078.088.098.108.11 Planck 2013 results. XVII. Gravitational lensing by large-scale structure, Planck Collaboration, 2014, A&A, 571, A17.
- ↑ Jump up to: 9.09.19.29.39.49.59.69.79.89.9 Planck intermediate results. XLI. A map of lensing-induced B-modes, Planck Collaboration Int. XLI A&A, 596, A102, (2016).
- ↑ Jump up to: 10.010.110.210.3 Planck 2015 results. XXV. Diffuse low frequency Galactic foregrounds, Planck Collaboration, 2016, A&A, 594, A25.
- Jump up ↑ Planck intermediate results. XXIX. All-sky dust modelling with Planck, IRAS, and WISE observations', Planck Collaboration Int. XXIX, A&A, 586, A132, (2016).
- Jump up ↑ Planck 2015 results. XXII. A map of the thermal Sunyaev-Zeldovich effect, Planck Collaboration, 2016, A&A, 594, A22.
- Jump up ↑ Planck 2015 results. XXI. The integrated Sachs-Wolfe effect, Planck Collaboration, 2016, A&A, 594, A21.
- ↑ Jump up to: 14.014.114.214.314.414.514.614.7 Planck 2013 results. XI. Component separation, Planck Collaboration, 2014, A&A, 571, A11.
- Jump up ↑ Component separation methods for the PLANCK mission, S. M. Leach, J.-F. Cardoso, C. Baccigalupi, R. B. Barreiro, M. Betoule, J. Bobin, A. Bonaldi, J. Delabrouille, G. de Zotti, C. Dickinson, H. K. Eriksen, J. González-Nuevo, F. K. Hansen, D. Herranz, M. Le Jeune, M. López-Caniego, E. Martínez-González, M. Massardi, J.-B. Melin, M.-A. Miville-Deschênes, G. Patanchon, S. Prunet, S. Ricciardi, E. Salerno, J. L. Sanz, J.-L. Starck, F. Stivoli, V. Stolyarov, R. Stompor, P. Vielva, A&A, 491, 597-615, (2008).
- Jump up ↑ Multiresolution internal template cleaning: an application to the Wilkinson Microwave Anisotropy Probe 7-yr polarization data, R. Fernández-Cobos, P. Vielva, R. B. Barreiro, E. Martínez-González, MNRAS, 420, 2162-2169, (2012).
- Jump up ↑ Wilkinson Microwave Anisotropy Probe 7-yr constraints on fNL with a fast wavelet estimator, B. Casaponsa, R. B. Barreiro, A. Curto, E. Martínez-González, P. Vielva, MNRAS, 411, 2019-2025, (2011).
- ↑ Jump up to: 18.018.1 Planck 2013 results. XXIII. Isotropy and statistics of the CMB, Planck Collaboration, 2014, A&A, 571, A23.
- ↑ Jump up to: 19.019.1 Planck 2013 results. XIX. The integrated Sachs-Wolfe effect, Planck Collaboration, 2014, A&A, 571, A19.
- ↑ Jump up to: 20.020.1 Planck 2013 results. XII. All-sky model of thermal dust emission, Planck Collaboration, 2014, A&A, 571, A12.
- Jump up ↑ Calibrating Milky Way dust extinction using cosmological sources, E. Mörtsell, A&A, 550, A80, (2013).
- Jump up ↑ The Sloan Digital Sky Survey Quasar Catalog. IV. Fifth Data Release, D. P. Schneider, P. B. Hall, G. T. Richards, M. A. Strauss, D. E. Vanden Berk, S. F. Anderson, W. N. Brandt, X. Fan, S. Jester, J. Gray, J. E. Gunn, M. U. SubbaRao, A. R. Thakar, C. Stoughton, A. S. Szalay, B. Yanny, D. G. York, N. A. Bahcall, J. Barentine, M. R. Blanton, H. Brewington, J. Brinkmann, R. J. Brunner, F. J. Castander, I. Csabai, J. A. Frieman, M. Fukugita, M. Harvanek, D. W. Hogg, Z. Ivezic, S. M. Kent, S. J. Kleinman, G. R. Knapp, R. G. Kron, J. Krzesinski, D. C. Long, R. H. Lupton, A. Nitta, J. R. Pier, D. H. Saxe, Y. Shen, S. A. Snedden, D. H. Weinberg, J. Wu, ApJ, 134, 102-117, (2007).
- Jump up ↑ Planck 2013 results. XIII. Galactic CO emission, Planck Collaboration, 2014, A&A, 571, A13.
Flexible Image Transfer Specification
Full-Width-at-Half-Maximum
Cosmic Microwave background
(Hierarchical Equal Area isoLatitude Pixelation of a sphere, <ref name="Template:Gorski2005">HEALPix: A Framework for High-Resolution Discretization and Fast Analysis of Data Distributed on the Sphere, K. M. Górski, E. Hivon, A. J. Banday, B. D. Wandelt, F. K. Hansen, M. Reinecke, M. Bartelmann, ApJ, 622, 759-771, (2005).
Sunyaev-Zel'dovich
Planck Legacy Archive
(Planck) Low Frequency Instrument
(Planck) High Frequency Instrument
reduced IMO
