Difference between revisions of "Foreground maps"
(→Previous Releases: (2013) Lensing Maps) |
(→2015 Compton y parameter map) |
||
| (45 intermediate revisions by 3 users not shown) | |||
| Line 1: | Line 1: | ||
| − | = Astrophysical Components= | + | = 2018 Astrophysical Components= |
== Overview == | == Overview == | ||
| Line 52: | Line 52: | ||
=====Thermal dust emission===== | =====Thermal dust emission===== | ||
| − | : Full-mission file name: {{PLASingleFile|fileType=map|name=COM_CompMap_QU_thermaldust-commander_2048_R3.00_full.fits|link= | + | : Full-mission file name: {{PLASingleFile|fileType=map|name=COM_CompMap_QU_thermaldust-commander_2048_R3.00_full.fits|link=COM_CompMap_QU_thermaldust-commander_2048_R3.00_full.fits}} |
| − | : First half-mission split file name: {{PLASingleFile|fileType=map|name=COM_CompMap_QU_thermaldust-commander_2048_R3.00_hm1.fits|link= | + | : First half-mission split file name: {{PLASingleFile|fileType=map|name=COM_CompMap_QU_thermaldust-commander_2048_R3.00_hm1.fits|link=COM_CompMap_QU_thermaldust-commander_2048_R3.00_hm1.fits}} |
| − | : Second half-mission split file name: {{PLASingleFile|fileType=map|name=COM_CompMap_QU_thermaldust-commander_2048_R3.00_hm2.fits|link= | + | : Second half-mission split file name: {{PLASingleFile|fileType=map|name=COM_CompMap_QU_thermaldust-commander_2048_R3.00_hm2.fits|link=COM_CompMap_QU_thermaldust-commander_2048_R3.00_hm2.fits}} |
| − | : Odd ring split file name: {{PLASingleFile|fileType=map|name=COM_CompMap_QU_thermaldust-commander_2048_R3.00_oe1.fits|link= | + | : Odd ring split file name: {{PLASingleFile|fileType=map|name=COM_CompMap_QU_thermaldust-commander_2048_R3.00_oe1.fits|link=COM_CompMap_QU_thermaldust-commander_2048_R3.00_oe1.fits}} |
| − | : Even ring split file name: {{PLASingleFile|fileType=map|name=COM_CompMap_QU_thermaldust-commander_2048_R3.00_oe2.fits|link= | + | : Even ring split file name: {{PLASingleFile|fileType=map|name=COM_CompMap_QU_thermaldust-commander_2048_R3.00_oe2.fits|link=COM_CompMap_QU_thermaldust-commander_2048_R3.00_oe2.fits}} |
: Nside = 2048 | : Nside = 2048 | ||
: Angular resolution = 5 arcmin | : Angular resolution = 5 arcmin | ||
| Line 69: | Line 69: | ||
|Q_STOKES || Real*4 || uK_RJ || Full-mission Stokes Q posterior maximum | |Q_STOKES || Real*4 || uK_RJ || Full-mission Stokes Q posterior maximum | ||
|- | |- | ||
| − | |U_STOKES || Real*4 || uK_RJ || Full-mission Stokes U posterior maximum | + | |U_STOKES || Real*4 || uK_RJ || Full-mission Stokes U posterior maximum |
| + | |- | ||
| + | |BETA || Real*4 || || Spectral index (full mission only) | ||
|} | |} | ||
| Line 134: | Line 136: | ||
|} | |} | ||
| − | + | ==GNILC thermal dust maps== | |
The 2018 GNILC thermal dust products are provided as single files that include both intensity and polarization, 3x3 IQU noise covariance matrices per pixel, and as well as local smoothing scale for the variable resolution map. The structure of the data files is the following: | The 2018 GNILC thermal dust products are provided as single files that include both intensity and polarization, 3x3 IQU noise covariance matrices per pixel, and as well as local smoothing scale for the variable resolution map. The structure of the data files is the following: | ||
| Line 172: | Line 174: | ||
|} | |} | ||
| − | = | + | = Previous Releases: (2015) and (2013) Foreground Maps = |
| − | == 2015 | + | <div class="toccolours mw-collapsible mw-collapsed" style="background-color: #FFDAB9;width:80%"> |
| + | '''Astrophysical components based on the 2015 data release''' | ||
| + | <div class="mw-collapsible-content"> | ||
| − | + | == Overview == | |
| + | This section describes the maps of astrophysical components produced from the Planck data. These products are derived from some or all of the nine frequency channel maps described above using different techniques and, in some cases, using other constraints from external data sets. Here we give a brief description of each product and how it is obtained, followed by a description of the FITS file containing the data and associated information. | ||
| + | All the details can be found in {{PlanckPapers|planck2014-a12}} and {PlanckPapers|planck20}}. | ||
| + | == Astrophysical foregrounds from parametric component separation == | ||
| + | We describe diffuse foreground products for the Planck 2015 release. See the Planck Foregrounds Component Separation paper {{PlanckPapers|planck2014-a12}} for a detailed description of these products. Further scientific discussion and interpretation may be found in {{PlanckPapers|planck2014-a31}}. | ||
| − | + | '''Low-resolution temperature products''' | |
| + | : The Planck 2015 astrophysical component separation analysis combines Planck observations with the 9-year WMAP temperature sky maps (Bennett et al. 2013) and the 408 MHz survey by Haslam et al. (1982). This allows a direct decomposition of the low-frequency foregrounds into separate synchrotron, free-free and spinning dust components without strong spatial priors. | ||
| + | '''Inputs''' | ||
| − | + | The following data products are used for the low-resolution analysis: | |
| − | | | + | * Full-mission 30 GHz frequency map, {{PLAFreqMaps|inst=LFI|freq=30|period=Full|link=LFI 30 GHz frequency maps}} |
| − | | | + | * Full-mission 44 GHz frequency map, {{PLAFreqMaps|inst=LFI|freq=44|period=Full|link=LFI 44 GHz frequency maps}} |
| − | + | * Full-mission 70 GHz ds1 (18+23), ds2 (19+22), and ds3 (20+21) detector-set maps | |
| − | + | * Full-mission 100 GHz ds1 and ds2 detector set maps | |
| − | | | + | * Full-mission 143 GHz ds1 and ds2 detector set maps and detectors 5, 6, and 7 maps |
| − | + | * Full-mission 217 GHz detector 1, 2, 3 and 4 maps | |
| − | + | * Full-mission 353 GHz detector set ds2 and detector 1 maps | |
| − | + | * Full-mission 545 GHz detector 2 and 4 maps | |
| − | + | * Full-mission 857 GHz detector 2 map | |
| − | + | * Beam-symmetrized 9-year WMAP K-band map [http://lambda.gsfc.nasa.gov/product/map/dr5/skymap_info.cfm (Lambda)] | |
| − | + | * Beam-symmetrized 9-year WMAP Ka-band map [http://lambda.gsfc.nasa.gov/product/map/dr5/skymap_info.cfm (Lambda)] | |
| − | + | * Default 9-year WMAP Q1 and Q2 differencing assembly maps [http://lambda.gsfc.nasa.gov/product/map/dr5/skymap_info.cfm (Lambda)] | |
| + | * Default 9-year WMAP V1 and V2 differencing assembly maps [http://lambda.gsfc.nasa.gov/product/map/dr5/skymap_info.cfm (Lambda)] | ||
| + | * Default 9-year WMAP W1, W2, W3, and W4 differencing assembly maps [http://lambda.gsfc.nasa.gov/product/map/dr5/skymap_info.cfm (Lambda)] | ||
| + | * Re-processed 408 MHz survey map, Remazeilles et al. (2014) [http://lambda.gsfc.nasa.gov/product/foreground/2014_haslam_408_info.cfm (Lambda)] | ||
| + | All maps are smoothed to a common resolution of 1 degree FWHM by deconvolving their original instrumental beam and pixel window, and convolving with the new common Gaussian beam, and repixelizing at Nside=256. | ||
| − | + | '''Outputs''' | |
| − | + | ===Synchrotron emission=== | |
| − | === | + | <!--<center> |
| + | <gallery style="padding:0 0 0 0;" perrow=3 widths=800px heights=500px> | ||
| + | File:commander_synch_amp.png | '''Commander low-resolution synchrotron amplitude''' | ||
| + | </gallery> | ||
| + | </center>--> | ||
| − | + | : File name: {{PLASingleFile|fileType=map|name=COM_CompMap_Synchrotron-commander_0256_R2.00.fits|link=COM_CompMap_Synchrotron-commander_0256_R2.00.fits}} | |
| + | : Reference frequency: 408 MHz | ||
| + | : Nside = 256 | ||
| + | : Angular resolution = 60 arcmin | ||
| − | + | {| border="1" cellpadding="5" cellspacing="0" align="center" style="text-align:center" | |
| − | + | |+ HDU -- COMP-MAP-Synchrotron | |
| − | + | |- | |
| − | + | |- bgcolor="ffdead" | |
| − | + | ! Column Name || Data Type || Units || Description | |
| − | + | |- | |
| − | + | |I_ML || Real*4 || uK_RJ || Amplitude posterior maximum | |
| − | + | |- | |
| − | + | |I_MEAN || Real*4 || uK_RJ || Amplitude posterior mean | |
| − | + | |- | |
| − | + | |I_RMS || Real*4 || uK_RJ || Amplitude posterior rms | |
| − | + | |} | |
| − | |||
| − | |||
| − | |||
| − | |||
| − | |||
| − | |||
| − | |||
| − | |||
| − | + | {| border="1" cellpadding="5" cellspacing="0" align="center" style="text-align:center" | |
| − | + | |+ Extension 1 -- SYNC-TEMP | |
| − | |||
| − | |||
| − | |||
| − | |||
| − | |||
| − | |||
| − | |||
| − | |||
| − | |||
| − | |||
| − | |||
| − | |||
| − | |||
| − | |||
| − | {| border="1" cellpadding=" | ||
| − | |+ | ||
| − | |||
| − | |||
|- | |- | ||
| − | | | + | |- bgcolor="ffdead" |
| + | ! Column Name || Data Type || Units || Description | ||
|- | |- | ||
| − | | | + | |nu || Real*4 || Hz || Frequency |
|- | |- | ||
| − | | | + | |intensity || Real*4 || W/Hz/m2/sr || GALPROP z10LMPD_SUNfE spectrum |
| − | |||
| − | |||
| − | |||
| − | |||
| − | |||
| − | |||
| − | |||
| − | |||
|} | |} | ||
| − | = | + | ===Free-free emission=== |
| − | + | : File name: {{PLASingleFile|fileType=map|name=COM_CompMap_freefree-commander_0256_R2.00.fits|link=COM_CompMap_freefree-commander_0256_R2.00.fits}} | |
| − | + | : Reference frequency: NA | |
| − | + | : Nside = 256 | |
| + | : Angular resolution = 60 arcmin | ||
| − | + | {| border="1" cellpadding="5" cellspacing="0" align="center" style="text-align:center" | |
| − | + | |+ HDU -- COMP-MAP-freefree | |
| − | + | |- | |
| + | |- bgcolor="ffdead" | ||
| + | ! Column Name || Data Type || Units || Description | ||
| + | |- | ||
| + | |EM_ML || Real*4 || cm^-6 pc || Emission measure posterior maximum | ||
| + | |- | ||
| + | |EM_MEAN || Real*4 || cm^-6 pc || Emission measure posterior mean | ||
| + | |- | ||
| + | |EM_RMS || Real*4 || cm^-6 pc || Emission measure posterior rms | ||
| + | |- | ||
| + | |TEMP_ML || Real*4 || K || Electron temperature posterior maximum | ||
| + | |- | ||
| + | |TEMP_MEAN || Real*4 || K || Electron temperature posterior mean | ||
| + | |- | ||
| + | |TEMP_RMS || Real*4 || K || Electron temperature posterior rms | ||
| + | |} | ||
| − | |||
| − | |||
| − | + | ===Spinning dust emission=== | |
| − | : | + | : File name: {{PLASingleFile|fileType=map|name=COM_CompMap_AME-commander_0256_R2.00.fits|link=COM_CompMap_AME-commander_0256_R2.00.fits}} |
| + | : Nside = 256 | ||
| + | : Angular resolution = 60 arcmin | ||
| − | + | Note: The spinning dust component has two independent constituents, each corresponding to one spdust2 component, but with different peak frequencies. The two components are stored in the two first FITS extensions, and the template frequency spectrum is stored in the third extension. | |
| − | + | : Reference frequency: 22.8 GHz | |
| − | + | {| border="1" cellpadding="5" cellspacing="0" align="center" style="text-align:center" | |
| − | + | |+ HDU -- COMP-MAP-AME1 | |
| − | + | |- | |
| − | + | |- bgcolor="ffdead" | |
| − | + | ! Column Name || Data Type || Units || Description | |
| − | + | |- | |
| − | + | |I_ML || Real*4 || uK_RJ || Primary amplitude posterior maximum | |
| − | + | |- | |
| − | + | |I_MEAN || Real*4 || uK_RJ || Primary amplitude posterior mean | |
| − | + | |- | |
| − | + | |I_RMS || Real*4 || uK_RJ || Primary amplitude posterior rms | |
| − | |||
| − | |||
| − | |||
| − | |||
| − | |||
| − | |||
| − | |||
| − | |||
| − | |||
| − | |||
| − | |||
| − | |||
| − | |||
| − | |||
| − | |||
| − | |||
| − | |||
| − | |||
| − | |||
| − | |||
| − | |||
| − | {| border="1" cellpadding="5" cellspacing="0" align="center" style="text-align:center" | ||
| − | |+ HDU -- COMP-MAP- | ||
|- | |- | ||
| − | | | + | |FREQ_ML || Real*4 || GHz || Primary peak frequency posterior maximum |
| − | |||
|- | |- | ||
| − | | | + | |FREQ_MEAN || Real*4 || GHz || Primary peak frequency posterior mean |
|- | |- | ||
| − | | | + | |FREQ_RMS || Real*4 || GHz || Primary peak frequency posterior rms |
| − | |||
| − | |||
|} | |} | ||
| − | + | : Reference frequency: 41.0 GHz | |
| + | : Peak frequency: 33.35 GHz | ||
{| border="1" cellpadding="5" cellspacing="0" align="center" style="text-align:center" | {| border="1" cellpadding="5" cellspacing="0" align="center" style="text-align:center" | ||
| − | |+ Extension 1 -- | + | |+ Extension 1 -- COMP-MAP-AME2 |
|- | |- | ||
|- bgcolor="ffdead" | |- bgcolor="ffdead" | ||
! Column Name || Data Type || Units || Description | ! Column Name || Data Type || Units || Description | ||
|- | |- | ||
| − | | | + | |I_ML || Real*4 || uK_RJ || Secondary amplitude posterior maximum |
| + | |- | ||
| + | |I_MEAN || Real*4 || uK_RJ || Secondary amplitude posterior mean | ||
|- | |- | ||
| − | | | + | |I_RMS || Real*4 || uK_RJ || Secondary amplitude posterior rms |
|} | |} | ||
| − | |||
| − | |||
| − | |||
| − | |||
| − | |||
| − | |||
{| border="1" cellpadding="5" cellspacing="0" align="center" style="text-align:center" | {| border="1" cellpadding="5" cellspacing="0" align="center" style="text-align:center" | ||
| − | |+ | + | |+ Extension 2 -- SPINNING-DUST-TEMP |
|- | |- | ||
|- bgcolor="ffdead" | |- bgcolor="ffdead" | ||
! Column Name || Data Type || Units || Description | ! Column Name || Data Type || Units || Description | ||
|- | |- | ||
| − | | | + | |nu || Real*4 || GHz || Frequency |
|- | |- | ||
| − | | | + | |j_nu/nH || Real*4 || Jy sr-1 cm2/H || spdust2 spectrum |
| − | + | |} | |
| − | + | ||
| − | + | ===CO line emission=== | |
| − | |||
| − | | | ||
| − | |||
| − | |||
| − | |||
| − | |||
| − | + | : File name: {{PLASingleFile|fileType=map|name=COM_CompMap_CO-commander_0256_R2.00.fits|link=COM_CompMap_CO-commander_0256_R2.00.fits}} | |
| − | |||
| − | |||
| − | : File name: {{PLASingleFile|fileType=map|name= | ||
: Nside = 256 | : Nside = 256 | ||
: Angular resolution = 60 arcmin | : Angular resolution = 60 arcmin | ||
| − | Note: The | + | Note: The CO line emission component has three independent objects, corresponding to the J1->0, 2->1 and 3->2 lines, stored in separate extensions. |
| − | |||
{| border="1" cellpadding="5" cellspacing="0" align="center" style="text-align:center" | {| border="1" cellpadding="5" cellspacing="0" align="center" style="text-align:center" | ||
| − | |+ HDU -- COMP-MAP- | + | |+ HDU -- COMP-MAP-co10 |
|- | |- | ||
|- bgcolor="ffdead" | |- bgcolor="ffdead" | ||
! Column Name || Data Type || Units || Description | ! Column Name || Data Type || Units || Description | ||
|- | |- | ||
| − | |I_ML || Real*4 || | + | |I_ML || Real*4 || K_RJ km/s || CO(1-0) amplitude posterior maximum |
|- | |- | ||
| − | |I_MEAN || Real*4 || | + | |I_MEAN || Real*4 || K_RJ km/s || CO(1-0) amplitude posterior mean |
|- | |- | ||
| − | |I_RMS || Real*4 || | + | |I_RMS || Real*4 || K_RJ km/s || CO(1-0) amplitude posterior rms |
| + | |} | ||
| + | |||
| + | {| border="1" cellpadding="5" cellspacing="0" align="center" style="text-align:center" | ||
| + | |+ Extension 1 -- COMP-MAP-co21 | ||
|- | |- | ||
| − | | | + | |- bgcolor="ffdead" |
| + | ! Column Name || Data Type || Units || Description | ||
| + | |- | ||
| + | |I_ML || Real*4 || K_RJ km/s || CO(2-1) amplitude posterior maximum | ||
|- | |- | ||
| − | | | + | |I_MEAN || Real*4 || K_RJ km/s || CO(2-1) amplitude posterior mean |
|- | |- | ||
| − | | | + | |I_RMS || Real*4 || K_RJ km/s || CO(2-1) amplitude posterior rms |
|} | |} | ||
| − | |||
| − | |||
{| border="1" cellpadding="5" cellspacing="0" align="center" style="text-align:center" | {| border="1" cellpadding="5" cellspacing="0" align="center" style="text-align:center" | ||
| − | |+ Extension | + | |+ Extension 2 -- COMP-MAP-co32 |
|- | |- | ||
|- bgcolor="ffdead" | |- bgcolor="ffdead" | ||
! Column Name || Data Type || Units || Description | ! Column Name || Data Type || Units || Description | ||
|- | |- | ||
| − | |I_ML || Real*4 || | + | |I_ML || Real*4 || K_RJ km/s || CO(3-2) amplitude posterior maximum |
|- | |- | ||
| − | |I_MEAN || Real*4 || | + | |I_MEAN || Real*4 || K_RJ km/s || CO(3-2) amplitude posterior mean |
|- | |- | ||
| − | |I_RMS || Real*4 || | + | |I_RMS || Real*4 || K_RJ km/s || CO(3-2) amplitude posterior rms |
|} | |} | ||
| + | ===94/100 GHz line emission=== | ||
| + | |||
| + | : File name: {{PLASingleFile|fileType=map|name=COM_CompMap_xline-commander_0256_R2.00.fits|link=COM_CompMap_xline-commander_0256_R2.00.fits}} | ||
| + | : Nside = 256 | ||
| + | : Angular resolution = 60 arcmin | ||
{| border="1" cellpadding="5" cellspacing="0" align="center" style="text-align:center" | {| border="1" cellpadding="5" cellspacing="0" align="center" style="text-align:center" | ||
| − | |+ | + | |+ HDU -- COMP-MAP-xline |
|- | |- | ||
|- bgcolor="ffdead" | |- bgcolor="ffdead" | ||
! Column Name || Data Type || Units || Description | ! Column Name || Data Type || Units || Description | ||
|- | |- | ||
| − | | | + | |I_ML || Real*4 || uK_cmb || Amplitude posterior maximum |
| + | |- | ||
| + | |I_MEAN || Real*4 || uK_cmb || Amplitude posterior mean | ||
|- | |- | ||
| − | | | + | |I_RMS || Real*4 || uK_cmb || Amplitude posterior rms |
|} | |} | ||
| − | + | Note: The amplitude of this component is normalized according to the 100-ds1 detector set map, ie., it is the amplitude as measured by this detector combination. | |
| + | |||
| + | ===Thermal dust emission=== | ||
| − | : File name: {{PLASingleFile|fileType=map|name= | + | : File name: {{PLASingleFile|fileType=map|name=COM_CompMap_dust-commander_0256_R2.00.fits|link=COM_CompMap_dust-commander_0256_R2.00.fits}} |
: Nside = 256 | : Nside = 256 | ||
: Angular resolution = 60 arcmin | : Angular resolution = 60 arcmin | ||
| − | + | : Reference frequency: 545 GHz | |
| − | |||
{| border="1" cellpadding="5" cellspacing="0" align="center" style="text-align:center" | {| border="1" cellpadding="5" cellspacing="0" align="center" style="text-align:center" | ||
| − | |+ HDU -- COMP-MAP- | + | |+ HDU -- COMP-MAP-dust |
|- | |- | ||
|- bgcolor="ffdead" | |- bgcolor="ffdead" | ||
! Column Name || Data Type || Units || Description | ! Column Name || Data Type || Units || Description | ||
|- | |- | ||
| − | |I_ML || Real*4 || | + | |I_ML || Real*4 || uK_RJ || Amplitude posterior maximum |
|- | |- | ||
| − | |I_MEAN || Real*4 || | + | |I_MEAN || Real*4 || uK_RJ || Amplitude posterior mean |
|- | |- | ||
| − | |I_RMS || Real*4 || | + | |I_RMS || Real*4 || uK_RJ || Amplitude posterior rms |
| − | |||
| − | |||
| − | |||
| − | |||
|- | |- | ||
| − | | | + | |TEMP_ML || Real*4 || K || Dust temperature posterior maximum |
| − | |||
|- | |- | ||
| − | | | + | |TEMP_MEAN || Real*4 || K || Dust temperature posterior mean |
|- | |- | ||
| − | | | + | |TEMP_RMS || Real*4 || K || Dust temperature posterior rms |
|- | |- | ||
| − | | | + | |BETA_ML || Real*4 || NA || Emissivity index posterior maximum |
| − | |||
| − | |||
| − | |||
| − | |||
|- | |- | ||
| − | | | + | |BETA_MEAN || Real*4 || NA || Emissivity index posterior mean |
| − | |||
|- | |- | ||
| − | | | + | |BETA_RMS || Real*4 || NA || Emissivity index posterior rms |
| − | |||
| − | |||
| − | |||
| − | |||
|} | |} | ||
| − | + | ===Thermal Sunyaev-Zeldovich emission around the Coma and Virgo clusters=== | |
| − | : File name: {{PLASingleFile|fileType=map|name= | + | : File name: {{PLASingleFile|fileType=map|name=COM_CompMap_SZ-commander_0256_R2.00.fits|link=COM_CompMap_SZ-commander_0256_R2.00.fits}} |
: Nside = 256 | : Nside = 256 | ||
: Angular resolution = 60 arcmin | : Angular resolution = 60 arcmin | ||
{| border="1" cellpadding="5" cellspacing="0" align="center" style="text-align:center" | {| border="1" cellpadding="5" cellspacing="0" align="center" style="text-align:center" | ||
| − | |+ HDU -- COMP-MAP- | + | |+ HDU -- COMP-MAP-SZ |
|- | |- | ||
|- bgcolor="ffdead" | |- bgcolor="ffdead" | ||
! Column Name || Data Type || Units || Description | ! Column Name || Data Type || Units || Description | ||
|- | |- | ||
| − | | | + | |Y_ML || Real*4 || y_SZ || Y parameter posterior maximum |
|- | |- | ||
| − | | | + | |Y_MEAN || Real*4 || y_SZ || Y parameter posterior mean |
|- | |- | ||
| − | | | + | |Y_RMS || Real*4 || y_SZ || Y parameter posterior rms |
|} | |} | ||
| − | + | '''High-resolution temperature products''' | |
| − | + | High-resolution foreground products at 7.5 arcmin FWHM are derived with the same algorithm as for the low-resolution analyses, but including frequency channels above (and including) 143 GHz. | |
| − | : File name: {{PLASingleFile|fileType=map|name= | + | '''Inputs''' |
| − | : Nside = | + | |
| − | : Angular resolution = | + | The following data products are used for the low-resolution analysis: |
| + | * Full-mission 143 GHz ds1 and ds2 detector set maps and detectors 5, 6, and 7 maps | ||
| + | * Full-mission 217 GHz detector 1, 2, 3 and 4 maps | ||
| + | * Full-mission 353 GHz detector set ds2 and detector 1 maps | ||
| + | * Full-mission 545 GHz detector 2 and 4 maps | ||
| + | * Full-mission 857 GHz detector 2 map | ||
| + | All maps are smoothed to a common resolution of 7.5 arcmin FWHM by deconvolving their original instrumental beam and pixel window, and convolving with the new common Gaussian beam, and repixelizing at Nside=2048. | ||
| + | |||
| + | '''Outputs''' | ||
| + | |||
| + | '''CO J2->1 emission''' | ||
| + | |||
| + | : File name: {{PLASingleFile|fileType=map|name=COM_CompMap_CO21-commander_2048_R2.00.fits|link=COM_CompMap_CO21-commander_2048_R2.00.fits}} | ||
| + | : Nside = 2048 | ||
| + | : Angular resolution = 7.5 arcmin | ||
| − | |||
{| border="1" cellpadding="5" cellspacing="0" align="center" style="text-align:center" | {| border="1" cellpadding="5" cellspacing="0" align="center" style="text-align:center" | ||
| − | |+ HDU -- COMP-MAP- | + | |+ HDU -- COMP-MAP-CO21 |
|- | |- | ||
|- bgcolor="ffdead" | |- bgcolor="ffdead" | ||
! Column Name || Data Type || Units || Description | ! Column Name || Data Type || Units || Description | ||
|- | |- | ||
| − | | | + | |I_ML_FULL || Real*4 || K_RJ km/s || Full-mission amplitude posterior maximum |
|- | |- | ||
| − | | | + | |I_ML_HM1 || Real*4 || K_RJ km/s || First half-mission amplitude posterior maximum |
|- | |- | ||
| − | | | + | |I_ML_HM2 || Real*4 || K_RJ km/s || Second half-mission amplitude posterior maximum |
|- | |- | ||
| − | | | + | |I_ML_HR1 || Real*4 || K_RJ km/s || First half-ring amplitude posterior maximum |
|- | |- | ||
| − | | | + | |I_ML_HR2 || Real*4 || K_RJ km/s || Second half-ring amplitude posterior maximum |
|- | |- | ||
| − | | | + | |I_ML_YR1 || Real*4 || K_RJ km/s || "First year" amplitude posterior maximum |
|- | |- | ||
| − | | | + | |I_ML_YR2 || Real*4 || K_RJ km/s || "Second year" amplitude posterior maximum |
| − | |||
| − | |||
| − | |||
| − | |||
|} | |} | ||
| − | |||
| − | : File name: {{PLASingleFile|fileType=map|name= | + | '''Thermal dust emission''' |
| − | : Nside = | + | |
| − | : Angular resolution = | + | : File name: {{PLASingleFile|fileType=map|name=COM_CompMap_ThermalDust-commander_2048_R2.00.fits|link=COM_CompMap_ThermalDust-commander_2048_R2.00.fits}} |
| + | : Nside = 2048 | ||
| + | : Angular resolution = 7.5 arcmin | ||
| + | : Reference frequency: 545 GHz | ||
{| border="1" cellpadding="5" cellspacing="0" align="center" style="text-align:center" | {| border="1" cellpadding="5" cellspacing="0" align="center" style="text-align:center" | ||
| − | |+ HDU -- COMP-MAP- | + | |+ HDU -- COMP-MAP-dust |
|- | |- | ||
|- bgcolor="ffdead" | |- bgcolor="ffdead" | ||
! Column Name || Data Type || Units || Description | ! Column Name || Data Type || Units || Description | ||
|- | |- | ||
| − | | | + | |I_ML_FULL || Real*4 || uK_RJ || Full-mission amplitude posterior maximum |
| + | |- | ||
| + | |I_ML_HM1 || Real*4 || uK_RJ || First half-mission amplitude posterior maximum | ||
|- | |- | ||
| − | | | + | |I_ML_HM2 || Real*4 || uK_RJ || Second half-mission amplitude posterior maximum |
|- | |- | ||
| − | | | + | |I_ML_HR1 || Real*4 || uK_RJ || First half-ring amplitude posterior maximum |
| − | |} | + | |- |
| + | |I_ML_HR2 || Real*4 || uK_RJ || Second half-ring amplitude posterior maximum | ||
| + | |- | ||
| + | |I_ML_YR1 || Real*4 || uK_RJ || "First year" amplitude posterior maximum | ||
| + | |- | ||
| + | |I_ML_YR2 || Real*4 || uK_RJ || "Second year" amplitude posterior maximum | ||
| + | |- | ||
| + | |BETA_ML_FULL || Real*4 || NA || Full-mission emissivity index posterior maximum | ||
| + | |- | ||
| + | |BETA_ML_HM1 || Real*4 || NA || First half-mission emissivity index posterior maximum | ||
| + | |- | ||
| + | |BETA_ML_HM2 || Real*4 || NA || Second half-mission emissivity index posterior maximum | ||
| + | |- | ||
| + | |BETA_ML_HR1 || Real*4 || NA || First half-ring emissivity index posterior maximum | ||
| + | |- | ||
| + | |BETA_ML_HR2 || Real*4 || NA || Second half-ring emissivity index posterior maximum | ||
| + | |- | ||
| + | |BETA_ML_YR1 || Real*4 || NA || "First year" emissivity index posterior maximum | ||
| + | |- | ||
| + | |BETA_ML_YR2 || Real*4 || NA || "Second year" emissivity index posterior maximum | ||
| + | |- | ||
| + | |} | ||
| − | ''' | + | '''Polarization products''' |
| − | + | Two polarization foreground products are provided, namely synchrotron and thermal dust emission. The spectral models are assumed identical to the corresponding temperature spectral models. | |
'''Inputs''' | '''Inputs''' | ||
| − | The following data products are used for the low-resolution analysis | + | The following data products are used for the polarization analysis: |
| − | * Full-mission | + | * (Only low-resolution analysis) Full-mission 30 GHz frequency map, {{PLAFreqMaps|inst=LFI|freq=30|period=Full|link=LFI 30 GHz frequency maps}} |
| − | * Full-mission | + | * (Only low-resolution analysis) Full-mission 44 GHz frequency map, {{PLAFreqMaps|inst=LFI|freq=44|period=Full|link=LFI 44 GHz frequency maps}} |
| − | * Full-mission | + | * (Only low-resolution analysis) Full-mission 70 GHz frequency map, {{PLAFreqMaps|inst=LFI|freq=70|period=Full|link=LFI 70 GHz frequency maps}} |
| − | * Full-mission | + | * Full-mission 100 GHz frequency map, {{PLAFreqMaps|inst=LFI|freq=100|period=Full|link=HFI 100 GHz frequency maps}} |
| − | * Full-mission | + | * Full-mission 143 GHz frequency map, {{PLAFreqMaps|inst=LFI|freq=143|period=Full|link=HFI 143 GHz frequency maps}} |
| − | + | * Full-mission 217 GHz frequency map, {{PLAFreqMaps|inst=LFI|freq=217|period=Full|link=HFI 217 GHz frequency maps}} | |
| + | * Full-mission 353 GHz frequency map, {{PLAFreqMaps|inst=LFI|freq=353|period=Full|link=HFI 353 GHz frequency maps}} | ||
| + | In the low-resolution analysis, all maps are smoothed to a common resolution of 40 arcmin FWHM by deconvolving their original instrumental beam and pixel window, and convolving with the new common Gaussian beam, and repixelizing at Nside=256. In the high-resolution analysis (including only CMB and thermal dust emission), the corresponding resolution is 10 arcmin FWHM and Nside=1024. | ||
'''Outputs''' | '''Outputs''' | ||
| + | '''Synchrotron emission''' | ||
| − | + | : File name: {{PLASingleFile|fileType=map|name=COM_CompMap_SynchrotronPol-commander_0256_R2.00.fits|link=COM_CompMap_SynchrotronPol-commander_0256_R2.00.fits}} | |
| − | + | : Nside = 256 | |
| − | : File name: {{PLASingleFile|fileType=map|name= | + | : Angular resolution = 40 arcmin |
| − | : Nside = | ||
| − | : Angular resolution = | ||
| + | : Reference frequency: 30 GHz | ||
{| border="1" cellpadding="5" cellspacing="0" align="center" style="text-align:center" | {| border="1" cellpadding="5" cellspacing="0" align="center" style="text-align:center" | ||
| − | |+ HDU -- COMP-MAP- | + | |+ HDU -- COMP-MAP-SynchrotronPol |
|- | |- | ||
|- bgcolor="ffdead" | |- bgcolor="ffdead" | ||
! Column Name || Data Type || Units || Description | ! Column Name || Data Type || Units || Description | ||
|- | |- | ||
| − | | | + | |Q_ML_FULL || Real*4 || K_RJ km/s || Full-mission Stokes Q posterior maximum |
|- | |- | ||
| − | | | + | |U_ML_FULL || Real*4 || K_RJ km/s || Full-mission Stokes U posterior maximum |
| + | |- | ||
| + | |Q_ML_HM1 || Real*4 || K_RJ km/s || First half-mission Stokes Q posterior maximum | ||
| + | |- | ||
| + | |U_ML_HM1 || Real*4 || K_RJ km/s || First half-mission Stokes U posterior maximum | ||
| + | |- | ||
| + | |Q_ML_HM2 || Real*4 || K_RJ km/s || Second half-mission Stokes Q posterior maximum | ||
| + | |- | ||
| + | |U_ML_HM2 || Real*4 || K_RJ km/s || Second half-mission Stokes U posterior maximum | ||
| + | |- | ||
| + | |Q_ML_HR1 || Real*4 || K_RJ km/s || First half-ring Stokes Q posterior maximum | ||
| + | |- | ||
| + | |U_ML_HR1 || Real*4 || K_RJ km/s || First half-ring Stokes U posterior maximum | ||
| + | |- | ||
| + | |Q_ML_HR2 || Real*4 || K_RJ km/s || Second half-ring Stokes Q posterior maximum | ||
|- | |- | ||
| − | | | + | |U_ML_HR2 || Real*4 || K_RJ km/s || Second half-ring Stokes U posterior maximum |
|- | |- | ||
| − | | | + | |Q_ML_YR1 || Real*4 || K_RJ km/s || "First year" Stokes Q posterior maximum |
|- | |- | ||
| − | | | + | |U_ML_YR1 || Real*4 || K_RJ km/s || "First year" Stokes U posterior maximum |
|- | |- | ||
| − | | | + | |Q_ML_YR2 || Real*4 || K_RJ km/s || "Second year" Stokes Q posterior maximum |
|- | |- | ||
| − | | | + | |U_ML_YR2 || Real*4 || K_RJ km/s || "Second year" Stokes U posterior maximum |
|} | |} | ||
| Line 588: | Line 602: | ||
'''Thermal dust emission''' | '''Thermal dust emission''' | ||
| − | : File name: {{PLASingleFile|fileType=map|name= | + | : File name: {{PLASingleFile|fileType=map|name=COM_CompMap_DustPol-commander_1024_R2.00.fits|link=COM_CompMap_DustPol-commander_1024_R2.00.fits}} |
| − | : Nside = | + | : Nside = 1024 |
| − | : Angular resolution = | + | : Angular resolution = 10 arcmin |
| − | : Reference frequency: | + | : Reference frequency: 353 GHz |
{| border="1" cellpadding="5" cellspacing="0" align="center" style="text-align:center" | {| border="1" cellpadding="5" cellspacing="0" align="center" style="text-align:center" | ||
| − | |+ HDU -- COMP-MAP- | + | |+ HDU -- COMP-MAP-DustPol |
|- | |- | ||
|- bgcolor="ffdead" | |- bgcolor="ffdead" | ||
! Column Name || Data Type || Units || Description | ! Column Name || Data Type || Units || Description | ||
|- | |- | ||
| − | | | + | |Q_ML_FULL || Real*4 || uK_RJ || Full-mission Stokes Q posterior maximum |
|- | |- | ||
| − | | | + | |U_ML_FULL || Real*4 || uK_RJ || Full-mission Stokes U posterior maximum |
|- | |- | ||
| − | | | + | |Q_ML_HM1 || Real*4 || uK_RJ || First half-mission Stokes Q posterior maximum |
|- | |- | ||
| − | | | + | |U_ML_HM1 || Real*4 || uK_RJ || First half-mission Stokes U posterior maximum |
|- | |- | ||
| − | | | + | |Q_ML_HM2 || Real*4 || uK_RJ || Second half-mission Stokes Q posterior maximum |
|- | |- | ||
| − | | | + | |U_ML_HM2 || Real*4 || uK_RJ || Second half-mission Stokes U posterior maximum |
|- | |- | ||
| − | | | + | |Q_ML_HR1 || Real*4 || uK_RJ || First half-ring Stokes Q posterior maximum |
|- | |- | ||
| − | | | + | |U_ML_HR1 || Real*4 || uK_RJ || First half-ring Stokes U posterior maximum |
|- | |- | ||
| − | | | + | |Q_ML_HR2 || Real*4 || uK_RJ || Second half-ring Stokes Q posterior maximum |
|- | |- | ||
| − | | | + | |U_ML_HR2 || Real*4 || uK_RJ || Second half-ring Stokes U posterior maximum |
|- | |- | ||
| − | | | + | |Q_ML_YR1 || Real*4 || uK_RJ || "First year" Stokes Q posterior maximum |
|- | |- | ||
| − | | | + | |U_ML_YR1 || Real*4 || uK_RJ || "First year" Stokes U posterior maximum |
|- | |- | ||
| − | | | + | |Q_ML_YR2 || Real*4 || uK_RJ || "Second year" Stokes Q posterior maximum |
| − | |||
| − | |||
|- | |- | ||
| + | |U_ML_YR2 || Real*4 || uK_RJ || "Second year" Stokes U posterior maximum | ||
|} | |} | ||
| − | ''' | + | ''' Modelling of the thermal dust emission with the Draine and Li dust model ''' |
| − | + | The Planck, IRAS, and WISE infrared observations were fit with the dust model presented by Draine & Li in 2007 (DL07). | |
| + | The input maps, the DL07 model, and the fitting procedure and results are presented in {{PlanckPapers|planck2014-XXIX}}. | ||
| + | Here, we describe the input maps and the output maps, which are made available on the Planck Legacy Archive. | ||
'''Inputs''' | '''Inputs''' | ||
| − | The following data | + | The following data have been fit: |
| − | |||
| − | |||
| − | |||
| − | |||
| − | |||
| − | |||
| − | |||
| − | |||
| − | ' | + | * WISE 12 micron map |
| − | ''' | + | * IRAS 60 micron map |
| − | + | * IRAS 100 micron map | |
| − | : File name: {{PLASingleFile|fileType=map|name= | + | * Full-mission 353 GHz PR2 map |
| − | : Nside = | + | * Full-mission 545 GHz PR2 map |
| − | : Angular resolution = | + | * Full-mission 857 GHz PR2 map |
| + | |||
| + | The CIB monopole, the CMB anisotropries and the zodiacal light were subtracted to obtain dust emission maps from the sky emission maps. | ||
| + | All maps were smoothed to a common angular resolution of 5'. | ||
| + | |||
| + | '''Model Parameters''' | ||
| + | |||
| + | For each pixel of the inputs maps, we have fitted four parameters of the DL07 model: | ||
| + | |||
| + | * the dust mass surface density, Sigma_Mdust, | ||
| + | * the dust mass fraction in small PAH grains, q_PAH, | ||
| + | * the fraction of the total luminosity from dust heated by intense radiation fields, f_PDR, | ||
| + | * the starlight intensity heating the bulk of the dust, U_min. | ||
| + | |||
| + | The parameter maps and their uncertainties are gathered in one file. This file also includes the | ||
| + | chi2 of the fit per degree of freedom. | ||
| + | |||
| + | : File name: {{PLASingleFile|fileType=map|name=COM_CompMap_Dust-DL07-Parameters_2048_R2.00.fits|link=COM_CompMap_Dust-DL07-Parameters_2048_R2.00.fits}} | ||
| + | : Nside = 2048 | ||
| + | : Angular resolution = 5 arcmin | ||
| − | |||
{| border="1" cellpadding="5" cellspacing="0" align="center" style="text-align:center" | {| border="1" cellpadding="5" cellspacing="0" align="center" style="text-align:center" | ||
| − | |+ HDU -- COMP-MAP- | + | |+ HDU -- COMP-MAP-Dust-DL07-Parameters |
|- | |- | ||
|- bgcolor="ffdead" | |- bgcolor="ffdead" | ||
! Column Name || Data Type || Units || Description | ! Column Name || Data Type || Units || Description | ||
|- | |- | ||
| − | | | + | |Sigma_Mdust || Real*4 || Solar masses/kpc^2 || Dust mass surface density |
|- | |- | ||
| − | | | + | |Sigma_Mdust_unc || Real*4 || Solar masses/kpc^2 || Uncertainty (1 sigma) on Sigma_Mdust |
|- | |- | ||
| − | | | + | |q_PAH || Real*4 || dimensionless || Dust mass fraction in small PAH grains |
|- | |- | ||
| − | | | + | |q_PAH_unc || Real*4 || dimensionless || Uncertainty (1 sigma) on q_PAH |
|- | |- | ||
| − | | | + | |f_PDR || Real*4 || dimensionless || Fraction of the total luminosity from dust heated by intense radiation fields |
|- | |- | ||
| − | | | + | |f_PDR_unc || Real*4 || dimensionless || Uncertainty (1 sigma) on f_PDR |
|- | |- | ||
| − | | | + | |U_min || Real*4 || dimensionless || Starlight intensity heating the bulk of the dust |
|- | |- | ||
| − | | | + | |U_min_unc || Real*4 || dimensionless || Uncertainty (1 sigma) on U_min |
|- | |- | ||
| − | | | + | |Chi2_DOF || Real*4 || dimensionless || Chi2 of the fit per degree of freedom |
| − | |||
| − | |||
| − | |||
| − | |||
| − | |||
| − | |||
| − | |||
| − | |||
| − | |||
| − | |||
|} | |} | ||
| + | '''Visible extinction maps''' | ||
| − | + | We provide two exinctions maps at the visible V band: the value from the model (Av_DL) and the | |
| + | renormalized one (Av_RQ) that matches extinction estimates for quasars (QSOs) derived from the Sloan digital sky survey (SDSS) data. | ||
| − | : File name: {{PLASingleFile|fileType=map|name= | + | : File name: {{PLASingleFile|fileType=map|name=COM_CompMap_Dust-DL07-AvMaps_2048_R2.00.fits|link=COM_CompMap_Dust-DL07-AvMaps_2048_R2.00.fits}} |
| − | : Nside = | + | : Nside = 2048 |
| − | : Angular resolution = | + | : Angular resolution = 5 arcmin |
| − | |||
{| border="1" cellpadding="5" cellspacing="0" align="center" style="text-align:center" | {| border="1" cellpadding="5" cellspacing="0" align="center" style="text-align:center" | ||
| − | |+ HDU -- COMP-MAP- | + | |+ HDU -- COMP-MAP-Dust-DL07-AvMaps |
|- | |- | ||
|- bgcolor="ffdead" | |- bgcolor="ffdead" | ||
! Column Name || Data Type || Units || Description | ! Column Name || Data Type || Units || Description | ||
|- | |- | ||
| − | | | + | |Av_DL || Real*4 || magnitude || Extinction in the V band from the DL model |
|- | |- | ||
| − | | | + | |Av_DL_unc || Real*4 || magnitude || Uncertainty (1 sigma) on Av_DL |
|- | |- | ||
| − | | | + | |Av_RQ || Real*4 || magnitude || Extinction in the V band renormalized to match estimates from QSO SDSS observations |
|- | |- | ||
| − | | | + | |Av_RQ_unc || Real*4 || magnitude || Uncertainty (1 sigma) on Av_RQ |
| − | | | + | |} |
| − | | | + | |
| − | |- | + | '''Model Fluxes''' |
| − | | | + | |
| − | + | We provide the model predicted fluxes in the following file. | |
| − | + | ||
| + | : File name: {{PLASingleFile|fileType=map|name=COM_CompMap_Dust-DL07-ModelFluxes_2048_R2.00.fits|link=COM_CompMap_Dust-DL07-ModelFluxes_2048_R2.00.fits}} | ||
| + | : Nside = 2048 | ||
| + | : Angular resolution = 5 arcmin | ||
| + | |||
| + | {| border="1" cellpadding="5" cellspacing="0" align="center" style="text-align:center" | ||
| + | |+ HDU -- COMP-MAP-Dust-DL07-ModelFluxes | ||
|- | |- | ||
| − | | | + | |- bgcolor="ffdead" |
| + | ! Column Name || Data Type || Units || Description | ||
|- | |- | ||
| − | | | + | |Planck_857 || Real*4 || MJy/sr || Model flux in the Planck 857 GHz band |
|- | |- | ||
| − | | | + | |Planck_545 || Real*4 || MJy/sr || Model flux in the Planck 545 GHz band |
|- | |- | ||
| − | | | + | |Planck_353 || Real*4 || MJy/sr || Model flux in the Planck 353 GHz band |
|- | |- | ||
| − | | | + | |WISE_12 || Real*4 || MJy/sr || Model flux in the WISE 12 micron band |
|- | |- | ||
| − | | | + | |IRAS_60 || Real*4 || MJy/sr || Model flux in the IRAS 60 micron band |
|- | |- | ||
| − | | | + | |IRAS_100 || Real*4 || MJy/sr || Model flux in the IRAS 100 micron band |
|} | |} | ||
| − | |||
| − | |||
| − | |||
| − | |||
| − | |||
| − | + | == Thermal dust and CIB all-sky maps from GNILC component separation == | |
| + | We describe diffuse foreground products for the Planck 2015 release produced with the GNILC component separation method. See the Planck paper {{PlanckPapers|planck2016-XLVIII}} for a detailed discussion on these products. | ||
| + | |||
| + | ===Method=== | ||
| − | + | : The basic idea behind the Generalized Needlet Internal Linear Combination (GNILC) component-separation method ([http://adsabs.harvard.edu/abs/2011MNRAS.418..467R Remazeilles et al, MNRAS 2011]) is to disentangle specific components of emission not on the sole basis of the spectral (frequency) information but also on the basis of their distinct spatial information (angular power spectrum). The GNILC method has been applied to Planck data in order to disentangle Galactic dust emission and Cosmic Infrared Background (CIB) anisotropies. Both components have a similar spectral signature but a distinct angular power spectrum (spatial signature). The spatial information used by GNILC is under the form of priors for the angular power spectra of the CIB, the CMB, and the instrumental noise. No assumption is made on the Galactic signal, neither spectral or spatial. In that sense, GNILC is a blind component-separation method. GNILC operates on a needlet (spherical wavelet) frame, therefore adapting the component separation to the local conditions of contamination both over the sky and over the angular scales. | |
| − | + | ||
| − | + | ===Data=== | |
| − | |||
| − | |||
| − | |||
| − | The | + | : The data used by GNILC for the analysis are the Planck data release 2 (PR2) frequency maps from 30 to 857 GHz, and a 100 micron hybrid map combined from the SFD map ([http://adsabs.harvard.edu/abs/1998ApJ...500..525S Schlegel et al, ApJ 1998]) at large angular scales (> 30') and the IRIS map ([http://adsabs.harvard.edu/abs/2005ApJS..157..302M Miville-Deschênes et al, ApJS 2005]) at small angular scales (< 30'). This special 100 micron map can be obtained in the External Maps section of the PLA. |
| − | |||
| − | + | ===Pre-processing=== | |
| − | + | : The point-sources with a signal-to-noise ratio, S/N > 5, in each individual frequency map (30 to 857 GHz, and 100 micron) have been pre-processed by a minimum curvature surface inpainting technique ([http://adsabs.harvard.edu/abs/2015MNRAS.451.4311R Remazeilles et al, MNRAS 2015]) prior to performing component separation with GNILC. | |
| − | + | ===GNILC thermal dust and CIB products=== | |
| − | |||
| − | |||
| − | |||
| − | The | + | The result of GNILC component separation are thermal dust and CIB maps at 353, 545, and 857 GHz. In addition, by fitting a modified blackbody model to the GNILC thermal dust products at 353, 545, 857, and 100 micron, we have created all-sky maps of the dust optical depth, dust temperature, and dust emmissivity index. Note that the thermal dust maps have a variable angular resolution over the sky with an effective beam FWHM varying from 21.8' to 5'. The dust beam FWHM map is also released as a product. |
| − | |||
| − | + | ====Thermal dust maps==== | |
| − | |||
| − | |||
{| border="1" cellpadding="5" cellspacing="0" align="center" style="text-align:center" | {| border="1" cellpadding="5" cellspacing="0" align="center" style="text-align:center" | ||
| − | |+ HDU -- COMP-MAP- | + | |+ HDU -- COMP-MAP-DUST |
|- | |- | ||
|- bgcolor="ffdead" | |- bgcolor="ffdead" | ||
| − | ! | + | ! File Name || Nside || Units || Reference frequency || Angular resolution || Description |
|- | |- | ||
| − | | | + | |{{PLASingleFile|fileType=map|name=COM_CompMap_Dust-GNILC-F353_2048_R2.00.fits|link=COM_CompMap_Dust-GNILC-F353_2048_R2.00.fits}} || 2048 || MJy/sr || 353 GHz || {{PLASingleFile|fileType=map|name=COM_CompMap_Dust-GNILC-Beam-FWHM_0128_R2.00.fits|link=COM_CompMap_Dust-GNILC-Beam-FWHM_0128_R2.00.fits}} || Thermal dust amplitude at 353 GHz |
|- | |- | ||
| − | | | + | |{{PLASingleFile|fileType=map|name=COM_CompMap_Dust-GNILC-F545_2048_R2.00.fits|link=COM_CompMap_Dust-GNILC-F545_2048_R2.00.fits}} || 2048 || MJy/sr || 545 GHz || {{PLASingleFile|fileType=map|name=COM_CompMap_Dust-GNILC-Beam-FWHM_0128_R2.00.fits|link=COM_CompMap_Dust-GNILC-Beam-FWHM_0128_R2.00.fits}} || Thermal dust amplitude at 545 GHz |
|- | |- | ||
| − | | | + | |{{PLASingleFile|fileType=map|name=COM_CompMap_Dust-GNILC-F857_2048_R2.00.fits|link=COM_CompMap_Dust-GNILC-F857_2048_R2.00.fits}} || 2048 || MJy/sr || 857 GHz || {{PLASingleFile|fileType=map|name=COM_CompMap_Dust-GNILC-Beam-FWHM_0128_R2.00.fits|link=COM_CompMap_Dust-GNILC-Beam-FWHM_0128_R2.00.fits}} || Thermal dust amplitude at 857 GHz |
|- | |- | ||
| − | | | + | |{{PLASingleFile|fileType=map|name=COM_CompMap_Dust-GNILC-Model-Opacity_2048_R2.01.fits|link=COM_CompMap_Dust-GNILC-Model-Opacity_2048_R2.01.fits}} (version 2.01 includes the error map)<br>{{PLASingleFile|fileType=map|name=COM_CompMap_Dust-GNILC-Model-Opacity_2048_R2.00.fits|link=COM_CompMap_Dust-GNILC-Model-Opacity_2048_R2.00.fits}}|| 2048 || NA || 353 GHz || {{PLASingleFile|fileType=map|name=COM_CompMap_Dust-GNILC-Beam-FWHM_0128_R2.00.fits|link=COM_CompMap_Dust-GNILC-Beam-FWHM_0128_R2.00.fits}} || Thermal dust optical depth at 353 GHz |
|- | |- | ||
| − | | | + | |{{PLASingleFile|fileType=map|name=COM_CompMap_Dust-GNILC-Model-Spectral-Index_2048_R2.01.fits|link=COM_CompMap_Dust-GNILC-Model-Spectral-Index_2048_R2.01.fits}} (version 2.01 includes the error map)<br>{{PLASingleFile|fileType=map|name=COM_CompMap_Dust-GNILC-Model-Spectral-Index_2048_R2.00.fits|link=COM_CompMap_Dust-GNILC-Model-Spectral-Index_2048_R2.00.fits}} || 2048 || NA || NA || {{PLASingleFile|fileType=map|name=COM_CompMap_Dust-GNILC-Beam-FWHM_0128_R2.00.fits|link=COM_CompMap_Dust-GNILC-Beam-FWHM_0128_R2.00.fits}} || Thermal dust emissivity index |
|- | |- | ||
| − | | | + | |{{PLASingleFile|fileType=map|name=COM_CompMap_Dust-GNILC-Model-Temperature_2048_R2.01.fits|link=COM_CompMap_Dust-GNILC-Model-Temperature_2048_R2.01.fits}} (version 2.01 includes the error map)<br>{{PLASingleFile|fileType=map|name=COM_CompMap_Dust-GNILC-Model-Temperature_2048_R2.00.fits|link=COM_CompMap_Dust-GNILC-Model-Temperature_2048_R2.00.fits}} || 2048 || K || NA || {{PLASingleFile|fileType=map|name=COM_CompMap_Dust-GNILC-Beam-FWHM_0128_R2.00.fits|link=COM_CompMap_Dust-GNILC-Beam-FWHM_0128_R2.00.fits}} || Thermal dust temperature |
|- | |- | ||
| − | | | + | |{{PLASingleFile|fileType=map|name=COM_CompMap_Dust-GNILC-Radiance_2048_R2.00.fits|link=COM_CompMap_Dust-GNILC-Radiance_2048_R2.00.fits}} || 2048 || W/m<sup>2</sup>/sr || NA || {{PLASingleFile|fileType=map|name=COM_CompMap_Dust-GNILC-Beam-FWHM_0128_R2.00.fits|link=COM_CompMap_Dust-GNILC-Beam-FWHM_0128_R2.00.fits}} || Thermal dust radiance |
|- | |- | ||
| − | | | + | | {{PLASingleFile|fileType=map|name=COM_CompMap_Dust-GNILC-Beam-FWHM_0128_R2.00.fits|link=COM_CompMap_Dust-GNILC-Beam-FWHM_0128_R2.00.fits}} || 128 || Arcminute || NA || NA || Effective dust beam FWHM |
|- | |- | ||
| − | |||
|} | |} | ||
| − | + | ====CIB maps==== | |
| − | |||
| − | |||
| − | |||
| − | |||
| − | |||
| − | |||
{| border="1" cellpadding="5" cellspacing="0" align="center" style="text-align:center" | {| border="1" cellpadding="5" cellspacing="0" align="center" style="text-align:center" | ||
| − | |+ HDU -- COMP-MAP- | + | |+ HDU -- COMP-MAP-CIB |
|- | |- | ||
|- bgcolor="ffdead" | |- bgcolor="ffdead" | ||
| − | ! | + | ! File Name || Nside || Units || Reference frequency || Angular resolution || Description |
|- | |- | ||
| − | | | + | |{{PLASingleFile|fileType=map|name=COM_CompMap_CIB-GNILC-F353_2048_R2.00.fits|link=COM_CompMap_CIB-GNILC-F353_2048_R2.00.fits}} || 2048 || MJy/sr || 353 GHz || 5 arcmin || CIB amplitude at 353 GHz |
|- | |- | ||
| − | | | + | |{{PLASingleFile|fileType=map|name=COM_CompMap_CIB-GNILC-F545_2048_R2.00.fits|link=COM_CompMap_CIB-GNILC-F545_2048_R2.00.fits}} || 2048 || MJy/sr || 545 GHz || 5 arcmin || CIB amplitude at 545 GHz |
|- | |- | ||
| − | | | + | |{{PLASingleFile|fileType=map|name=COM_CompMap_CIB-GNILC-F857_2048_R2.00.fits|link=COM_CompMap_CIB-GNILC-F857_2048_R2.00.fits}} || 2048 || MJy/sr || 857 GHz || 5 arcmin || CIB amplitude at 857 GHz |
|- | |- | ||
| − | |||
|} | |} | ||
| − | |||
| − | + | == Other Special maps == | |
| + | |||
| + | ===Introduction=== | ||
| + | |||
| + | This section describes the map-based products that required special processing. | ||
| + | |||
| + | |||
| + | === 2015 Compton <i>y</i> parameter map === | ||
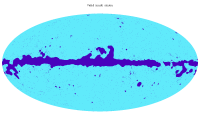
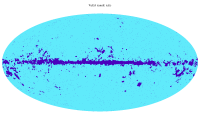
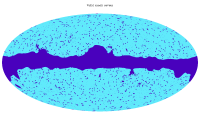
| − | + | We distribute here the Planck full mission Compton parameter maps (<i>y</i>-maps hereafter) obtained using the NILC and MILCA component-separation algorithms as described in {{PlanckPapers|planck2014-a28}}. We also provide the ILC weights per scale and per frequency that were used to produce these <i>y</i>-maps. IDL routines are also provided to allow the user to apply those weights [[:File: milca_nilc_IDL_routines.zip]]. Compton parameters produced by keeping either the first or the second half of stable pointing periods are also provided; we call these the FIRST and LAST <i>y</i>-maps. Additionally we construct noise estimates of full mission Planck <i>y</i>-maps from the half difference of the FIRST and LAST <i>y</i>-maps. These estimates are used to construct standard deviation maps of the noise in the full mission Planck <i>y</i>-maps, which are also provided. To complement this we also provide the power spectra of the noise estimate maps after correcting for inhomogeneities using the standard deviation maps. We also deliver foreground masks including point-source and Galactic masks. | |
| − | |||
| − | |||
| − | + | <span style="color:#ff0000"> Update 04 Aug 2017:</span> The file containing the masks named ''COM_CompMap_Compton-SZMap-masks_2048_R2.00.fits'' has been updated with the file ''COM_CompMap_Compton-SZMap-masks_2048_R2.01.fits''. The difference between the two is that in the R2.00 version a region around the Galactic pole had been masked, while only the Galactic plane should be masked. This has been fixed in version R2.01. The full updated data set is contained in a single gzipped tarball named ''COM_CompMap_YSZ_R2.01.fits.tgz''. The R2.00 version of the mask is not available in the PLA anymore, but can be requested via the PLA Helpdesk. | |
| − | |||
| − | |||
| − | |||
| − | |||
| − | |||
| − | |||
| − | |||
| − | |||
| − | |||
| − | |||
| − | |||
| − | |||
| − | |||
| − | |||
| − | |||
| − | |||
| − | |||
| − | |||
| − | |||
| − | ''' | ||
| − | |||
| − | |||
| − | |||
| − | |||
| − | |||
| − | '' | ||
| − | |||
| − | |||
| − | |||
| − | |||
| − | The | ||
| + | <span style="color:#ff0000"> Update 30 July 2018:</span> The angular power spectra homogeneous noise files nilc_homnoise_spect.fits and milca_homnoise_spect.fits in COM_CompMap_YSZ_R2.01.fits.tgz have been updated. A new version of the COM_CompMap_SZ_R2.02.fits.tgz package is available in the PLA. | ||
| + | The contents of the full data set are described below. | ||
{| border="1" cellpadding="3" cellspacing="0" align="center" style="text-align:left" | {| border="1" cellpadding="3" cellspacing="0" align="center" style="text-align:left" | ||
| − | |+ ''' Contents of | + | |+ ''' Contents of COM_CompMap_YSZ_R2.02.fits.tgz ''' |
|- bgcolor="ffdead" | |- bgcolor="ffdead" | ||
! Filename || Format || Description | ! Filename || Format || Description | ||
|- | |- | ||
| − | | | + | | nilc_ymaps.fits || HEALPix FITS format map in Galactic coordinates with <math>N_{\rm side}=2048 </math>|| Contains the NILC full mission, FIRST and LAST <i>y</i>-maps. |
|- | |- | ||
| − | + | | milca_ymaps.fits || HEALPix FITS format map in Galactic coordinates with <math> N_{\rm side} = 2048 </math> || Contains the MILCA full mission, FIRST and LAST <i>y</i>-maps. | |
| − | + | |- | |
| − | + | | nilc_weights_BAND.fits || HEALPix FITS format map in Galactic coordinates with <math> N_{\rm side} = 128 </math>|| Contains the NILC ILC weights for the full mission <i>y</i>-map for band BAND 0 to 9. For each band we provide a weight map per frequency. | |
| − | |||
| − | |||
| − | |||
| − | |||
| − | |||
| − | |||
| − | |||
| − | |||
| − | |||
| − | |||
| − | |||
| − | |||
| − | |||
| − | |||
| − | |||
| − | |||
| − | |||
| − | | milca_ymaps.fits || HEALPix FITS format map in Galactic coordinates with <math> N_{\rm side} = 2048 </math> || Contains the MILCA full mission, FIRST and LAST <i>y</i>-maps. | ||
| − | |- | ||
| − | | nilc_weights_BAND.fits || HEALPix FITS format map in Galactic coordinates with <math> N_{\rm side} = 128 </math>|| Contains the NILC ILC weights for the full mission <i>y</i>-map for band BAND 0 to 9. For each band we provide a weight map per frequency. | ||
|- | |- | ||
| milca_FREQ_Csz.fits || HEALPix FITS format map in Galactic coordinates with <math> N_{\rm side} = 2048 </math> || Contains the MILCA ILC weights for the full mission <i>y</i>-map for frequency FREQ (100, 143, 217, 353, 545, 857). For each frequency we provide a weight map per filter band. | | milca_FREQ_Csz.fits || HEALPix FITS format map in Galactic coordinates with <math> N_{\rm side} = 2048 </math> || Contains the MILCA ILC weights for the full mission <i>y</i>-map for frequency FREQ (100, 143, 217, 353, 545, 857). For each frequency we provide a weight map per filter band. | ||
| Line 905: | Line 863: | ||
|} | |} | ||
| + | === 2015 Integrated Sachs-Wolfe effect map === | ||
| − | + | We distribute estimates of the integrated Sachs-Wolfe (ISW) maps presented in {{PlanckPapers|planck2014-a26}} as part of the 2015 data release. These map represents an estimate of the ISW anisotropies using different data sets: | |
| − | + | * SEVEM DX11 CMB map, together with all the large-scale structure tracers considered in the ISW paper, namely: NVSS, SDSS, WISE, and the Planck lensing map | |
| + | * Using only the large-scale structure tracers mentioned above | ||
| + | * SEVEM DX11 CMB map, together with NVSS and the Planck lensing maps (since these two tracers capture most of the information, as compared to SDSS and WISE) | ||
| − | + | For all the three cases, the reconstruction is provided on approximately 85% of the sky, and they are produced using the LCB filter described in the Planck ISW paper (Section 5), described in detail in [http://cdsads.u-strasbg.fr/abs/2008ISTSP...2..747B| Barreiro et al. 2008] and [http://cdsads.u-strasbg.fr/doi/10.1093/mnras/stw415| Bonavera et al. 2016]. | |
| − | '' | + | These ISW maps, together with their corresponding uncertainties maps and masks, are given in a file named ''{{PLASingleFile|fileType=map|name=COM_CompMap_ISW_0064_R2.00.fits|link=COM_CompMap_ISW_0064_R2.00.fits}}''. Its contents are described below. |
| − | |||
| − | + | {| border="1" cellpadding="3" cellspacing="0" align="center" style="text-align:left" | |
| − | + | |+ ''' Contents of the ISW maps file: COM_CompMap_ISW_0064_R2.00.fits ''' | |
| − | + | |- bgcolor="ffdead" | |
| − | + | ! Extension || Format || Description || Used data sets | |
| − | + | |- | |
| − | + | | 0 || HEALPix FITS format map with three components, <math>N_{\rm side}=64</math>, Ordering='Nest' || Contains three components: i) ISW map [Kelvin], ii) Error map [Kelvin], iii) Mask map || SEVEM DX11 CMB + NVSS + SDSS + WISE + Planck lensing. | |
| − | + | |- | |
| − | + | | 1 || HEALPix FITS format map with three components, <math>N_{\rm side}=64</math>, Ordering='Nest' || Contains three components: i) ISW map [Kelvin], ii) Error map [Kelvin], iii) Mask map || NVSS + SDSS + WISE + Planck lensing. | |
| − | + | |- | |
| + | | 2 || HEALPix FITS format map with three components, <math>N_{\rm side}=64</math>, Ordering='Nest' || Contains three components: i) ISW map [Kelvin], ii) Error map [Kelvin], iii) Mask map || SEVEM DX11 CMB + NVSS + Planck lensing. | ||
| + | |} | ||
| − | |||
| − | |||
| − | |||
| − | |||
| − | |||
| − | + | === 2015 Low-frequency foregrounds maps (Planck only & Planck+WMAP) === | |
| + | 1) CMB/free-free/Dust Nulled ILC at 28.4 GHz (Planck only) | ||
| − | + | Linear combination of Planck 28.4, 44.1, 143 and 353 GHz maps (all at 1 degree resolution), with weights listed in column w_2 of Table 1 in {{PlanckPapers|planck2014-a31}}. These weights exactly null the CMB, almost exactly null free-free emission, and null thermal dust emission to high accuracy except along the inner Galactic plane,where the brightness is uncertain by around 20% due to variation in the dust spectrum. The normalisation leaves a beta = -3 power law at the same amplitude as in the Planck 28.4 GHz map. (As presented in Fig. 3a of Planck 2015 Results XXV.) | |
| − | + | 2) CMB/free-free/Dust Nulled ILC at 28.4 GHz (Planck + WMAP) | |
| + | Linear combination of WMAP K, Ka, and Q band, and Planck 28.4, 44.1, 143 and 353 GHz maps (all at 1 degree resolution), with weights listed in column w_3 of Table 1 in {{PlanckPapers|planck2014-a31}}. These weights exactly null the CMB, almost exactly null free-free emission, and null thermal dust emission to high accuracy except along the inner Galactic plane, where the brightness is uncertain by around 20% due to variation in the dust spectrum. The normalisation leaves a beta = -3 power law at the same amplitude as in the Planck 28.4 GHz map. (As presented in Fig. 3b of {{PlanckPapers|planck2014-a31}}.) | ||
| − | < | + | </div> |
| + | </div> | ||
| − | + | <div class="toccolours mw-collapsible mw-collapsed" style="background-color: #EEE8AA;width:80%"> | |
| + | '''Astrophysical components based on the 2013 data release''' | ||
| + | <div class="mw-collapsible-content"> | ||
| − | + | ''' Overview ''' | |
| − | |||
| − | |||
| − | + | This section describes the maps of astrophysical components produced from the Planck data. These products are derived from some or all of the nine frequency channel maps described above using different techniques and, in some cases, using other constraints from external data sets. Here we give a brief description of the product and how it is obtained, followed by a description of the FITS file containing the data and associated information. | |
| + | All the details can be found in {{PlanckPapers|planck2013-p06}}. | ||
| + | |||
| + | '''CMB maps''' | ||
| − | + | CMB maps have been produced by the SMICA, NILC, SEVEM and COMMANDER-Ruler pipelines. Of these, the SMICA product is considered the preferred one overall and is labelled ''Main product'' in the Planck Legacy Archive, while the other two are labeled as ''Additional product''. | |
| + | SMICA and NILC also produce ''inpainted'' maps, in which the Galactic Plane, some bright regions and masked point sources are replaced with a constrained CMB realization such that the whole map has the same statistical distribution as the observed CMB. | ||
| − | + | The results of SMICA, NILC and SEVEM pipeline are distributed as a FITS file containing 4 extensions: | |
| − | + | # CMB maps and ancillary products (3 or 6 maps) | |
| − | + | # CMB-cleaned foreground maps from LFI (3 maps) | |
| − | + | # CMB-cleaned foreground maps from HFI (6 maps) | |
| − | + | # Effective beam of the CMB maps (1 vector) | |
| − | |||
| − | |||
| − | |||
| − | |||
| − | |||
| − | |||
| − | |||
| − | |||
| − | |||
| − | |||
| − | |||
| − | |||
| − | |||
| − | |||
| − | ' | + | The results of COMMANDER-Ruler are distributed as two FITS files (the high and low resolution) containing the following extensions: |
| + | High resolution N$_\rm{side}$=2048 (note that we don't provide the CMB-cleaned foregrounds maps for LFI and HFI because the Ruler resolution (~7.4') is lower than the HFI highest channel and and downgrading it will introduce noise correlation). | ||
| + | # CMB maps and ancillary products (4 maps) | ||
| + | # Effective beam of the CMB maps (1 vector) | ||
| − | + | Low resolution N$_\rm{side}$=256 | |
| + | # CMB maps and ancillary products (3 maps) | ||
| + | # 10 example CMB maps used in the montecarlo realization (10 maps) | ||
| + | # Effective beam of the CMB maps (1 vector) | ||
| − | + | For a complete description of the data structure, see the [[#File names and structure | below]]; the content of the first extensions is illustrated and commented in the table below. | |
| − | |||
| − | |||
| − | |||
| − | + | {| class="wikitable" border="1" cellpadding="3" cellspacing="0" align="center" style="text-align:center" style="background:#efefef;" | |
| − | + | |+ style="background:#eeeeee;" | '''The maps (CMB, noise, masks) contained in the first extension''' | |
| − | |||
| − | |||
| − | |+ ''' | ||
| − | |||
| − | |||
|- | |- | ||
| − | | | + | !width=40px | Col name |
| + | !width=200px| SMICA | ||
| + | !width=200px| NILC | ||
| + | !width=200px| SEVEM | ||
| + | !width=200px| COMMANDER-Ruler H | ||
| + | !width=200px| COMMANDER-Ruler L | ||
| + | !width=300px| Description / notes | ||
|- | |- | ||
| − | | 1 || | + | | align="left" | 1: I |
| + | | [[File: CMB-smica.png|200px]] | ||
| + | | [[File: CMB-nilc.png|200px]] | ||
| + | | [[File: CMB-sevem.png|200px]] | ||
| + | | [[File: CMB-CR_h.png|200px]] | ||
| + | | [[File: CMB-CR_l.png|200px]] | ||
| + | | Raw CMB anisotropy map. These are the maps used in the component separation paper {{PlanckPapers|planck2013-p06}}. | ||
|- | |- | ||
| − | + | | 2: NOISE | |
| − | + | | [[File: CMBnoise-smica.png|200px]] | |
| − | + | | [[File: CMBnoise-nilc.png|200px]] | |
| − | + | | [[File: CMBnoise-sevem.png|200px]] | |
| − | |||
| − | |||
| − | |||
| − | |||
| − | |||
| − | |||
| − | |||
| − | |||
| − | |||
| − | |||
| − | |||
| − | |||
| − | |||
| − | |||
| − | |||
| − | |||
| − | |||
| − | |||
| − | |||
| − | |||
| − | |||
| − | |||
| − | |||
| − | |||
| − | |||
| − | |||
| − | |||
| − | |||
| − | |||
| − | |||
| − | |||
| − | |||
| − | |||
| − | |||
| − | |||
| − | |||
| − | |||
| − | |||
| − | |||
| − | |||
| − | |||
| − | |||
| − | |||
| − | |||
| − | |||
| − | |||
| − | |||
| − | |||
| − | |||
| − | |||
| − | |||
| − | |||
| − | |||
| − | |||
| − | |||
| − | |||
| − | |||
| − | |||
| − | |||
| − | |||
| − | |||
| − | |||
| − | |||
| − | |||
| − | |||
| − | | 2: NOISE | ||
| − | | [[File: CMBnoise-smica.png|200px]] | ||
| − | | [[File: CMBnoise-nilc.png|200px]] | ||
| − | | [[File: CMBnoise-sevem.png|200px]] | ||
| [[File: CMBnoise-CR_h.png|200px]] | | [[File: CMBnoise-CR_h.png|200px]] | ||
| align='center' | not applicable | | align='center' | not applicable | ||
| Line 1,919: | Line 1,810: | ||
|} | |} | ||
| − | |||
| − | |||
| − | |||
| − | |||
| − | |||
| − | |||
| − | |||
| − | |||
| − | |||
| − | |||
| − | |||
| − | |||
| − | |||
| − | |||
| − | |||
| − | |||
| − | |||
| − | |||
| − | |||
| − | |||
| − | |||
| − | |||
| − | |||
| − | |||
| − | |||
| − | |||
| − | |||
| − | |||
| − | |||
| − | |||
| − | |||
| − | |||
| − | |||
| − | |||
| − | |||
| − | |||
| − | |||
| − | |||
| − | |||
| − | |||
| − | |||
| − | |||
| − | |||
| − | |||
| − | |||
| − | |||
| − | |||
| − | |||
| − | |||
| − | |||
| − | |||
| − | |||
| − | |||
| − | |||
| − | |||
| − | |||
| − | |||
| − | |||
| − | |||
| − | |||
| − | |||
| − | |||
| − | |||
| − | |||
| − | |||
| − | |||
| − | |||
| − | |||
| − | |||
| − | |||
| − | |||
| − | |||
| − | |||
| − | |||
| − | |||
| − | |||
| − | |||
| − | |||
| − | |||
| − | |||
| − | |||
| − | |||
| − | |||
| − | |||
| − | |||
| − | |||
| − | |||
| − | |||
| − | |||
| − | |||
| − | |||
| − | |||
| − | |||
| − | |||
| − | |||
| − | |||
| − | |||
| − | |||
| − | |||
| − | |||
| − | |||
| − | |||
| − | |||
| − | |||
| − | |||
| − | |||
| − | |||
| − | |||
| − | |||
| − | |||
| − | |||
| − | |||
| − | |||
| − | |||
| − | |||
| − | |||
| − | |||
| − | |||
| − | |||
| − | |||
| − | |||
| − | |||
| − | |||
| − | |||
</div> | </div> | ||
Latest revision as of 17:33, 22 October 2021
Contents
[hide]- 1 2018 Astrophysical Components
- 2 Previous Releases: (2015) and (2013) Foreground Maps
- 3 References
2018 Astrophysical Components[edit]
Overview[edit]
This section describes the maps of astrophysical components produced from the Planck data. These products are derived from some or all of the nine frequency channel maps described above using different techniques and, in some cases, using other constraints from external data sets. Here we give a brief description of each product and how it is obtained, followed by a description of the FITS file containing the data and associated information. All the details can be found in Planck-2020-A4[1] and Planck-2020-A8[2].
Commander-derived astrophysical foreground maps[edit]
As discussed in detail in Planck-2020-A4[1], the main Planck 2018 frequency sky maps have significantly lower systematic errors than earlier versions. At the same time, these maps are also associated with a significant limitation, in that no robust single detector or detector set maps are available. As described in Planck-2020-A3[3], such maps do not contain the full signal content of the true sky. As a result, only full frequency maps are distributed and used in the 2018 analysis.
For polarization analysis, this is not a significant issue, and the 2018 polarization foreground products therefore supersede the 2015 release in all respects. However, for temperature analysis the lack of single-detector maps strongly limits the ability to extract CO line emission from the data set, and it is also not possible to exclude known detector outliers; see Planck-2015-A10[4] for details. For these reasons, we consider the parametric foreground products from 2015 to represent a more accurate description of the true sky than the corresponding 2018 version. As a result, we do not release parametric temperature foreground products from the 2018 data set, but rather recommend continued usage of the 2015 temperature model. For polarization, we recommend usage of the 2018 model.
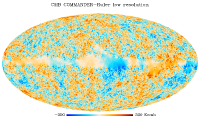
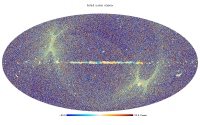
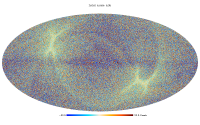
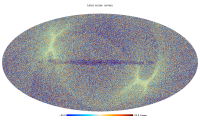
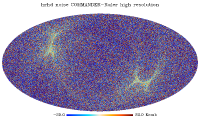
Two Commander-based polarization foreground products are provided for the Planck 2018 releaes, namely synchrotron and thermal dust emission. For synchrotron emission, a spatially constant spectral index of β=-3.1 is adopted. For thermal dust emission, the dust temperature is fixed to that derived from the corresponding 2018 intensity analysis, while the spectral index is fitted directly from the polarization measurements, smoothed to 3 degrees FWHM. For both synchrotron and thermal dust emission, we provide results derived from both the full-mission data set, and from the half-mission and odd-even splits.
In addition to the real observations, we also provide 300 end-to-end noise simulations processed through the algorithm with the same spectral parameters as derived from the data for each of the data splits. The filenames of these simulations have the following format:
- dx12_v3_commander_{synch,dust}_noise_{full,hm1,hm2,oe1,oe2}_00???_raw.fits
Inputs[edit]
The following data products are used for the full-mission polarization analysis (corresponding data are used for the data split products):
- Full-mission 30 GHz frequency map, LFI 30 GHz frequency maps
- Full-mission 44 GHz frequency map, LFI 44 GHz frequency maps
- Full-mission 70 GHz frequency map, LFI 70 GHz frequency maps
- Full-mission 100 GHz frequency map, HFI 100 GHz frequency maps
- Full-mission 143 GHz frequency map, HFI 143 GHz frequency maps
- Full-mission 217 GHz frequency map, HFI 217 GHz frequency maps
- Full-mission 353 GHz frequency map, HFI 353 GHz frequency maps
Outputs[edit]
Synchrotron emission[edit]
- Full-mission file name: COM_CompMap_QU_synchrotron-commander_2048_R3.00_full.fits
- First half-mission split file name: COM_CompMap_QU_synchrotron-commander_2048_R3.00_hm1.fits
- Second half-mission split file name: COM_CompMap_QU_synchrotron-commander_2048_R3.00_hm2.fits
- Odd ring split file name: COM_CompMap_QU_synchrotron-commander_2048_R3.00_oe1.fits
- Even ring split file name: COM_CompMap_QU_synchrotron-commander_2048_R3.00_oe2.fits
- Nside = 2048
- Angular resolution = 40 arcmin
- Reference frequency: 30 GHz
| Column Name | Data Type | Units | Description |
|---|---|---|---|
| Q_STOKES | Real*4 | μK_RJ | Stokes Q posterior maximum |
| U_STOKES | Real*4 | μK_RJ | Stokes U posterior maximum |
Thermal dust emission[edit]
- Full-mission file name: COM_CompMap_QU_thermaldust-commander_2048_R3.00_full.fits
- First half-mission split file name: COM_CompMap_QU_thermaldust-commander_2048_R3.00_hm1.fits
- Second half-mission split file name: COM_CompMap_QU_thermaldust-commander_2048_R3.00_hm2.fits
- Odd ring split file name: COM_CompMap_QU_thermaldust-commander_2048_R3.00_oe1.fits
- Even ring split file name: COM_CompMap_QU_thermaldust-commander_2048_R3.00_oe2.fits
- Nside = 2048
- Angular resolution = 5 arcmin
- Reference frequency: 353 GHz
| Column Name | Data Type | Units | Description |
|---|---|---|---|
| Q_STOKES | Real*4 | uK_RJ | Full-mission Stokes Q posterior maximum |
| U_STOKES | Real*4 | uK_RJ | Full-mission Stokes U posterior maximum |
| BETA | Real*4 | Spectral index (full mission only) |
SMICA-derived astrophysical foreground maps[edit]
Two SMICA-based polarization foreground products are provided, namely synchrotron and thermal dust emission. These are derived using the usual SMICA spectral matching method, tuned specifically for the reconstruction of two polarized foregrounds. Specifically, three coherent components (plus noise) are fitted at the spectral level with the first one constrained to have CMB emissivity. No assumptions are made regarding the other two components: they are not assumed to have a specific emissivity or angular spectrum, nor are they assumed to be uncorrelated. This leaves a degenerate model but that degeneracy can be entirely fixed after the spectral fit by assuming that synchrotron emission is negligible at 353 GHz and that thermal dust emission is negligible at 30 GHz. For both synchrotron and thermal dust emission, we provide results derived from both the full-mission data set, and from the half-mission and odd-even splits.
In addition to the real observations, we also provide 300 end-to-end noise simulations processed through the algorithm with the same spectral parameters as derived from the data for each of the data splits. The filenames of these simulations have the following format:
- dx12_v3_smica_{synch,dust}_noise_{full,hm1,hm2,oe1,oe2}_00???_raw.fits
Inputs[edit]
The following data products are used for the full-mission polarization analysis (corresponding data are used for the data split products):
- Full-mission 30 GHz frequency map, LFI 30 GHz frequency maps
- Full-mission 44 GHz frequency map, LFI 44 GHz frequency maps
- Full-mission 70 GHz frequency map, LFI 70 GHz frequency maps
- Full-mission 100 GHz frequency map, HFI 100 GHz frequency maps
- Full-mission 143 GHz frequency map, HFI 143 GHz frequency maps
- Full-mission 217 GHz frequency map, HFI 217 GHz frequency maps
- Full-mission 353 GHz frequency map, HFI 353 GHz frequency maps
Outputs[edit]
Synchrotron emission[edit]
- Full-mission file name: COM_CompMap_QU_synchrotron-smica_2048_R3.00_full.fits
- First half-mission split file name: COM_CompMap_QU_synchrotron-smica_2048_R3.00_hm1.fits
- Second half-mission split file name: COM_CompMap_QU_synchrotron-smica_2048_R3.00_hm2.fits
- Odd ring split file name: COM_CompMap_QU_synchrotron-smica_2048_R3.00_oe1.fits
- Even ring split file name: COM_CompMap_QU_synchrotron-smica_2048_R3.00_oe2.fits
- Nside = 2048
- Angular resolution = 40 arcmin
- Reference frequency: Integrated 30 GHz band; no colour corrections have been applied
| Column Name | Data Type | Units | Description |
|---|---|---|---|
| Q_STOKES | Real*4 | mK_RJ | Stokes Q posterior maximum |
| U_STOKES | Real*4 | mK_RJ | Stokes U posterior maximum |
Thermal dust emission[edit]
- Full-mission file name: COM_CompMap_QU_thermaldust-smica_2048_R3.00_full.fits
- First half-mission split file name: COM_CompMap_QU_thermaldust-smica_2048_R3.00_hm1.fits
- Second half-mission split file name: COM_CompMap_QU_thermaldust-smica_2048_R3.00_hm2.fits
- Odd ring split file name: COM_CompMap_QU_thermaldust-smica_2048_R3.00_oe1.fits
- Even ring split file name: COM_CompMap_QU_thermaldust-smica_2048_R3.00_oe2.fits
- Nside = 2048
- Angular resolution = 12 arcmin
- Reference frequency: Integrated 353 GHz band; no colour corrections have been applied
| Column Name | Data Type | Units | Description |
|---|---|---|---|
| Q_STOKES | Real*4 | mK_RJ | Full-mission Stokes Q posterior maximum |
| U_STOKES | Real*4 | mK_RJ | Full-mission Stokes U posterior maximum |
GNILC thermal dust maps[edit]
The 2018 GNILC thermal dust products are provided as single files that include both intensity and polarization, 3x3 IQU noise covariance matrices per pixel, and as well as local smoothing scale for the variable resolution map. The structure of the data files is the following:
- Uniform resolution file name: COM_CompMap_IQU_thermaldust-gnilc-unires_2048_R3.00.fits
- Variable resolution file name: COM_CompMap_IQU_thermaldust-gnilc-varres_2048_R3.00.fits
- Nside = 2048
- Angular resolution = 80 arcmin FWHM, or variable
- Reference frequency: Integrated 353 GHz band; no colour corrections have been applied
| Column Name | Data Type | Units | Description |
|---|---|---|---|
| I_STOKES | Real*4 | K_cmb | Stokes I estimate |
| Q_STOKES | Real*4 | K_cmb | Stokes Q estimate |
| U_STOKES | Real*4 | K_cmb | Stokes U estimate |
| II_COV | Real*4 | K_cmb^2 | Covariance matrix II element |
| IQ_COV | Real*4 | K_cmb^2 | Covariance matrix IQ element |
| IU_COV | Real*4 | K_cmb^2 | Covariance matrix IU element |
| QQ_COV | Real*4 | K_cmb^2 | Covariance matrix QQ element |
| QU_COV | Real*4 | K_cmb^2 | Covariance matrix QU element |
| UU_COV | Real*4 | K_cmb^2 | Covariance matrix UU element |
| FWHM | Real*4 | arcmin | Local FWHM smoothing scale |
Previous Releases: (2015) and (2013) Foreground Maps[edit]
Astrophysical components based on the 2015 data release
Astrophysical components based on the 2013 data release
References[edit]
- ↑ Jump up to: 1.01.1 Planck 2018 results. IV. Diffuse component separation, Planck Collaboration, 2020, A&A, 641, A4.
- Jump up ↑ Planck 2018 results. VIII. Lensing, Planck Collaboration, 2020, A&A, 641, A8.
- Jump up ↑ Planck 2018 results. III. High Frequency Instrument data processing and frequency maps, Planck Collaboration, 2020, A&A, 641, A3.
- ↑ Jump up to: 4.04.14.2 Planck 2015 results. X. Diffuse component separation: Foreground maps, Planck Collaboration, 2016, A&A, 594, A10.
- ↑ Jump up to: 5.05.15.25.3 Planck 2015 results. XXV. Diffuse low frequency Galactic foregrounds, Planck Collaboration, 2016, A&A, 594, A25.
- Jump up ↑ Planck intermediate results. XXIX. All-sky dust modelling with Planck, IRAS, and WISE observations', Planck Collaboration Int. XXIX, A&A, 586, A132, (2016).
- Jump up ↑ Planck intermediate results. XLVIII. Disentangling Galactic dust emission and cosmic infrared background anisotropies, Planck Collaboration Int. XLVIII A&A, 596, A109, (2016).
- Jump up ↑ Planck 2015 results. XXII. A map of the thermal Sunyaev-Zeldovich effect, Planck Collaboration, 2016, A&A, 594, A22.
- Jump up ↑ Planck 2015 results. XXI. The integrated Sachs-Wolfe effect, Planck Collaboration, 2016, A&A, 594, A21.
- ↑ Jump up to: 10.010.110.210.310.410.510.610.7 Planck 2013 results. XI. Component separation, Planck Collaboration, 2014, A&A, 571, A11.
- Jump up ↑ Component separation methods for the PLANCK mission, S. M. Leach, J.-F. Cardoso, C. Baccigalupi, R. B. Barreiro, M. Betoule, J. Bobin, A. Bonaldi, J. Delabrouille, G. de Zotti, C. Dickinson, H. K. Eriksen, J. González-Nuevo, F. K. Hansen, D. Herranz, M. Le Jeune, M. López-Caniego, E. Martínez-González, M. Massardi, J.-B. Melin, M.-A. Miville-Deschênes, G. Patanchon, S. Prunet, S. Ricciardi, E. Salerno, J. L. Sanz, J.-L. Starck, F. Stivoli, V. Stolyarov, R. Stompor, P. Vielva, A&A, 491, 597-615, (2008).
- Jump up ↑ Multiresolution internal template cleaning: an application to the Wilkinson Microwave Anisotropy Probe 7-yr polarization data, R. Fernández-Cobos, P. Vielva, R. B. Barreiro, E. Martínez-González, MNRAS, 420, 2162-2169, (2012).
- Jump up ↑ Wilkinson Microwave Anisotropy Probe 7-yr constraints on fNL with a fast wavelet estimator, B. Casaponsa, R. B. Barreiro, A. Curto, E. Martínez-González, P. Vielva, MNRAS, 411, 2019-2025, (2011).
- ↑ Jump up to: 14.014.1 Planck 2013 results. XXIII. Isotropy and statistics of the CMB, Planck Collaboration, 2014, A&A, 571, A23.
- ↑ Jump up to: 15.015.1 Planck 2013 results. XIX. The integrated Sachs-Wolfe effect, Planck Collaboration, 2014, A&A, 571, A19.
- ↑ Jump up to: 16.016.1 Planck 2013 results. XII. All-sky model of thermal dust emission, Planck Collaboration, 2014, A&A, 571, A12.
- Jump up ↑ Calibrating Milky Way dust extinction using cosmological sources, E. Mörtsell, A&A, 550, A80, (2013).
- Jump up ↑ The Sloan Digital Sky Survey Quasar Catalog. IV. Fifth Data Release, D. P. Schneider, P. B. Hall, G. T. Richards, M. A. Strauss, D. E. Vanden Berk, S. F. Anderson, W. N. Brandt, X. Fan, S. Jester, J. Gray, J. E. Gunn, M. U. SubbaRao, A. R. Thakar, C. Stoughton, A. S. Szalay, B. Yanny, D. G. York, N. A. Bahcall, J. Barentine, M. R. Blanton, H. Brewington, J. Brinkmann, R. J. Brunner, F. J. Castander, I. Csabai, J. A. Frieman, M. Fukugita, M. Harvanek, D. W. Hogg, Z. Ivezic, S. M. Kent, S. J. Kleinman, G. R. Knapp, R. G. Kron, J. Krzesinski, D. C. Long, R. H. Lupton, A. Nitta, J. R. Pier, D. H. Saxe, Y. Shen, S. A. Snedden, D. H. Weinberg, J. Wu, ApJ, 134, 102-117, (2007).
- Jump up ↑ Planck 2013 results. XIII. Galactic CO emission, Planck Collaboration, 2014, A&A, 571, A13.
Flexible Image Transfer Specification
Full-Width-at-Half-Maximum
Cosmic Microwave background
Sunyaev-Zel'dovich
Planck Legacy Archive
(Hierarchical Equal Area isoLatitude Pixelation of a sphere, <ref name="Template:Gorski2005">HEALPix: A Framework for High-Resolution Discretization and Fast Analysis of Data Distributed on the Sphere, K. M. Górski, E. Hivon, A. J. Banday, B. D. Wandelt, F. K. Hansen, M. Reinecke, M. Bartelmann, ApJ, 622, 759-771, (2005).
(Planck) Low Frequency Instrument
(Planck) High Frequency Instrument
reduced IMO
