Spectral response
Contents
[hide]Introduction[edit]
This section outlines the unit-conversion and colour-correction protocol for Planck/HFI, based on the measurements of the HFI detector chain spectral response (see Planck-2013-IX[1] and here for the description of the spectral response pre-launch measurements). These descriptions apply to individual detector responses and individual detector maps.
Maps which are made from combinations of detectors have an effective spectral response which is a weighted combination of the responses of each detector, and in principle it varies from pixel-to-pixel. The Reduced Instrument Model (RIMO) files contain the average spectral response for each type of (individual and combination) map produced.
Please note that the combined-detector maps produced in 2018 are made with the SRoll map-making code, which involves a correction for “bandpass mismatch” due to the spectral response imbalance between PSBs leading to intensity-to-polarization leakage. This correction is achieved by determining differences in response of individual detectors to specific foregrounds with respect to the CMB calibration. As a result of this correction, the effective bandpass of the combined-detector 2018 PR maps is the straight average of the spectral response of individual detectors, whereas for the equivalent 2015 or 2013 maps, the effective bandpass is the average of the spectral response of individual detectors weighted by the number of hits in each pixel. The bandpasses described in the 2018 and 2015 RIMOs are therefore not the same, and colour corrections are consequently slightly different. Single bolometer within a frequency band show response to foregrounds which differs from the CMB calibrated one (colour correction). Combination of PR2 single bolometer maps could be used to recover (or help recovering) foreground components (including narrow-band components such as CO line emission). Since the 2018 spectral response imbalances of individual detector maps can no longer be used for this purpose, we do not deliver them.
HFI Spectral Response[edit]
The band-averaged HFI spectral response data are shown in the figure below, and provided in the the instrument model. Similar data are available for individual detectors as well as sub-band averaged data sets (i.e., detset1, detset2, PSBs, SWBs). A table summarizing some of the spectral properties of the individual detectors, and band-averaged spectra, is shown at the bottom of this page.

The band-averaged spectrum for a given frequency band is derived using a hit-map-normalized inverse-square noise-weighted detector spectrum average. Thus, the effective band-averaged spectrum in question changes depending on Planck's coverage of the region of sky in question. This may change between different subsets of the Planck data, e.g., surveys, detector sets, etc. The histograms below demonstrate the variation across the sky of the detector weight coefficients used to determine the band-averaged spectra. Thus, the validity of using a single band-averaged spectrum for an entire sky map, may require evaluation depending on the task at hand. Some analyses may require incorporating the variation of the relative detector weights across the sky in order to understand the differential spectral transmission between complementary maps (e.g., detset-1 versus detset-2 maps). There are four groupings to consider with respect to the relative weighting of the individual detector contribution to the Planck data, and hence the relative contribution of a given detector spectrum to a band-averaged spectrum or sub-band-average spectrum: ring; detset; survey; and mask. There are three possible combinations for the ring grouping, accounting for whether the full ring is used in the map, just the first half, or the last half; the notation used here is F+L for the full ring, F for the first half, and L for the last half. The detset grouping has between three and five combinations per frequency band, accounting for the detectors to include in the average, including all detectors, detset1, detset2, only the PSB detectors (PSBs), or only the SWB detectors (SWBs). There are 11 possible survey options, including the full mission, nominal mission, Survey 1, Survey 2, Survey 3, Survey 4, Survey 5, Year 1, Year 2, Half-mission 1, and Half-mission 2. There are also six nominal masking options for the maps including 100%, 99%, 97%, 90%, 80%, and 60% of the sky (various degrees of masking the Galactic plane). Thus, for a given frequency band there could be up to almost 1000 (sub-)band-averaged spectra. While the images below only show the variation of detector contribution to the average for the full and nominal missions, a similar evaluation was conducted across the entire parameter space to determine the relevant average spectrum. This parameter space is also considered in determining the effective unit-conversion and colour-correction coefficients (see below).
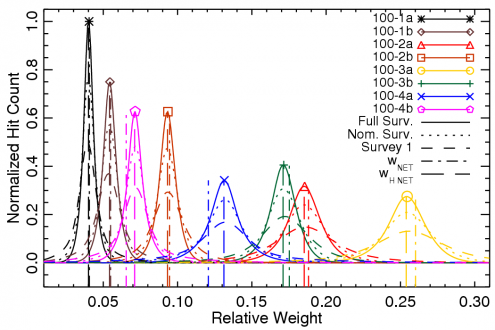
100 GHz.
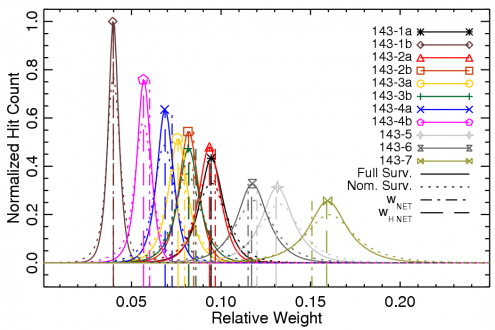
143 GHz.
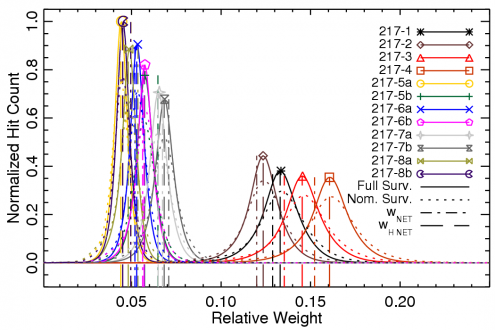
217 GHz.
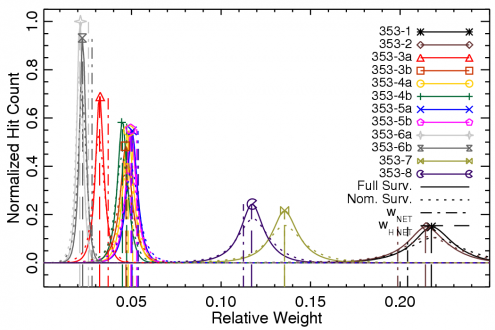
353 GHz.
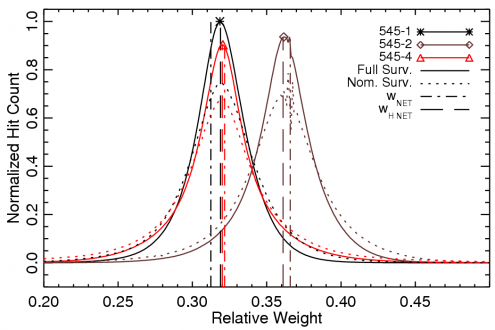
545 GHz.
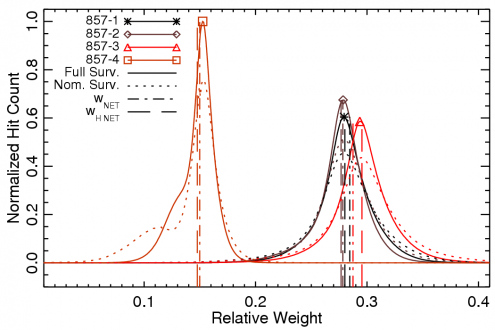
857 GHz.


Variation of individual detector contributions to band-averaged frequency maps across the sky, for various HFI surveys.
Colour Correction[edit]
As described in Planck-2013-IX[1], several unit-conversion and colour-correction coefficients may be useful in the analysis of Planck data. These include conversion from CMB temperature units to MJy sr-1, and colour-correction coefficients for conversion to a variety of spectral profiles. Software routines to determine these coefficients are provided here, and some example tables are provided here. A text file containing unit-conversion and colour-correction coefficients for all of the individual HFI detectors, as well as the band-averaged and sub-band-averaged spectra, is included at the bottom of this page. This file contains all of the iterations for the sub-band-averaged spectra, including ring, detset, survey, and mask variations.
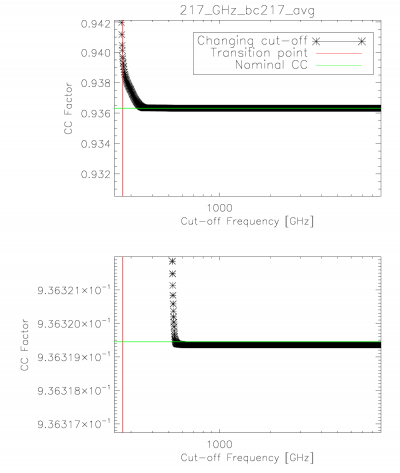
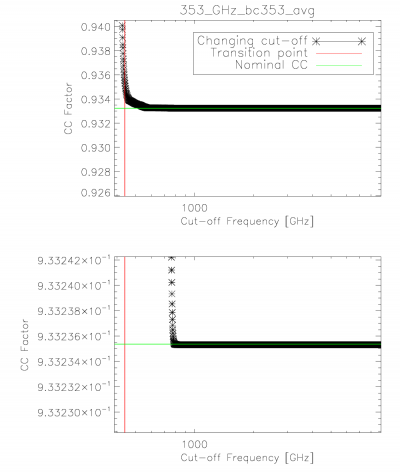
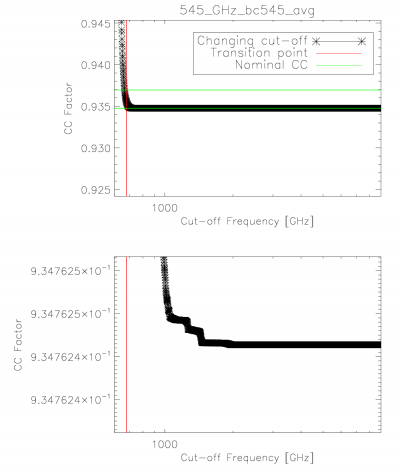
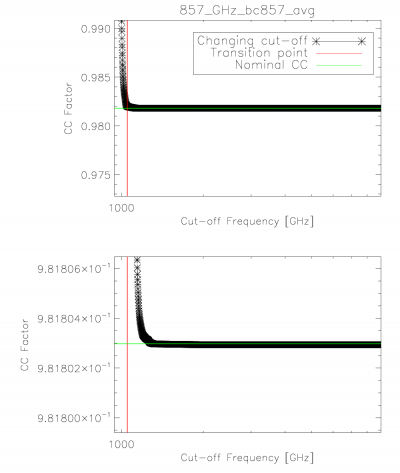
The integration ranges used in determining the unit-conversion and colour-correction coefficients provided were verified through an iterative approach starting at one extreme and reducing to the band-centre for both the low and high frequency edges. The figure below demonstrates the stability in the integral once a sufficient data range has been employed. The range used in the official coefficients is thus sufficient to ensure that it falls within the flat region of the demonstration figure below.
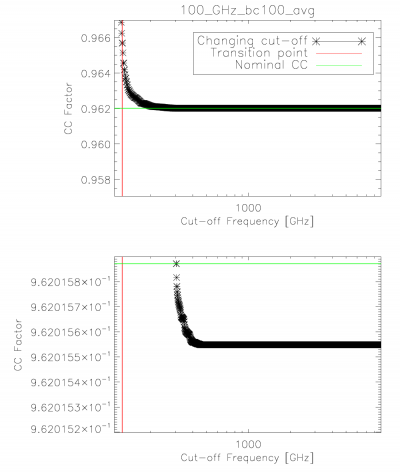
100 GHz.
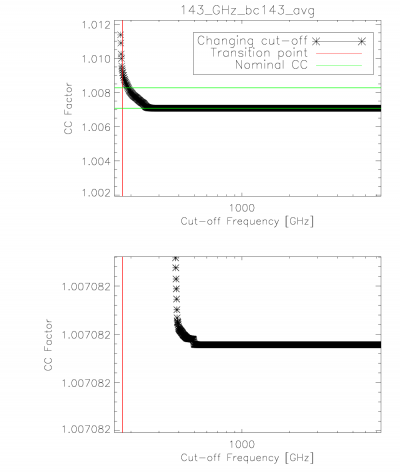
143 GHz.
217 GHz.
353 GHz.
545 GHz.
857 GHz.


Colour-correction (α = -1 to +2) stability with integration cut-off variation. The horizontal bars illustrate the nominal colour-correction values. Similar results are found for the integration cut-on.
The following table presents basic characteristics of the HFI detector spectral response, including optical efficiency, effective frequency, etc. Further details on the definition of these parameters are available in Planck-2013-IX[1].
| Band [GHz] | νcut-on [GHz] | νcut-off [GHz] | BW [GHz] | νcen. [GHz] | νeff. [GHz] | ε | εInt. | ν-1 [GHz] | ν+2 [GHz] | ν+4 [GHz] |
| 100-1a | 84.8 ± 0.5 | 113.96 ± 0.16 | 29.1 ± 0.6 | 99.4 ± 0.3 | 100.28 ± 0.11 | 0.419 ± 0.008 | 0.310 ± 0.008 | 99.45 ± 0.12 | 101.93 ± 0.11 | 103.59 ± 0.10 |
| 100-1b | 86.5 ± 1.0 | 115.32 ± 0.08 | 28.8 ± 1.0 | 100.9 ± 0.5 | 100.87 ± 0.11 | 0.563 ± 0.011 | 0.324 ± 0.011 | 100.06 ± 0.11 | 102.51 ± 0.10 | 104.18 ± 0.09 |
| 100-2a | 86.0 ± 0.6 | 116.4 ± 0.4 | 30.4 ± 0.9 | 101.2 ± 0.3 | 101.34 ± 0.12 | 0.550 ± 0.012 | 0.372 ± 0.012 | 100.38 ± 0.12 | 103.34 ± 0.11 | 105.47 ± 0.10 |
| 100-2b | 84.3 ± 0.5 | 115.5 ± 0.4 | 31.3 ± 0.7 | 99.9 ± 0.3 | 101.19 ± 0.11 | 0.634 ± 0.009 | 0.334 ± 0.009 | 100.23 ± 0.11 | 103.14 ± 0.10 | 105.16 ± 0.09 |
| 100-3a | 84.21 ± 0.17 | 117.36 ± 0.06 | 33.14 ± 0.18 | 100.78 ± 0.09 | 101.64 ± 0.12 | 0.493 ± 0.005 | 0.331 ± 0.005 | 100.68 ± 0.12 | 103.60 ± 0.10 | 105.60 ± 0.09 |
| 100-3b | 84.19 ± 0.19 | 116.81 ± 0.16 | 32.6 ± 0.2 | 100.50 ± 0.13 | 100.63 ± 0.12 | 0.426 ± 0.004 | 0.281 ± 0.004 | 99.74 ± 0.12 | 102.45 ± 0.11 | 104.35 ± 0.10 |
| 100-4a | 84.74 ± 0.07 | 118.09 ± 0.09 | 33.34 ± 0.12 | 101.42 ± 0.05 | 101.77 ± 0.12 | 0.461 ± 0.003 | 0.255 ± 0.003 | 100.77 ± 0.13 | 103.82 ± 0.11 | 105.96 ± 0.10 |
| 100-4b | 84.9 ± 0.3 | 118.30 ± 0.05 | 33.4 ± 0.3 | 101.58 ± 0.14 | 101.91 ± 0.13 | 0.396 ± 0.003 | 0.258 ± 0.003 | 100.92 ± 0.13 | 103.92 ± 0.12 | 105.98 ± 0.10 |
| 100-avg | 84.4 ± 0.3 | 117.36 ± 0.05 | 32.9 ± 0.3 | 100.89 ± 0.13 | 101.31 ± 0.05 | 0.479 ± 0.003 | 0.304 ± 0.003 | 100.36 ± 0.05 | 103.24 ± 0.05 | 105.25 ± 0.04 |
| 100-detset1 | 84.77 ± 0.05 | 117.81 ± 0.06 | 33.03 ± 0.08 | 101.29 ± 0.04 | 101.43 ± 0.07 | 0.4199 ± 0.0020 | 0.2645 ± 0.0020 | 100.49 ± 0.07 | 103.35 ± 0.06 | 105.34 ± 0.06 |
| 100-detset2 | 84.3 ± 0.3 | 117.14 ± 0.05 | 32.8 ± 0.3 | 100.72 ± 0.13 | 101.25 ± 0.06 | 0.505 ± 0.003 | 0.321 ± 0.003 | 100.31 ± 0.06 | 103.19 ± 0.06 | 105.21 ± 0.05 |
| 143-1a | 121.2 ± 0.4 | 162 ± 2 | 41 ± 2 | 141.5 ± 1.1 | 141.71 ± 0.04 | 0.66 ± 0.02 | 0.43 ± 0.02 | 140.37 ± 0.04 | 144.48 ± 0.04 | 147.35 ± 0.03 |
| 143-1b | 119.99 ± 0.03 | 162.8 ± 0.7 | 42.8 ± 0.8 | 141.4 ± 0.4 | 142.29 ± 0.04 | 0.608 ± 0.007 | 0.347 ± 0.007 | 140.97 ± 0.04 | 145.02 ± 0.04 | 147.79 ± 0.04 |
| 143-2a | 119.7 ± 0.2 | 162.76 ± 0.05 | 43.1 ± 0.2 | 141.21 ± 0.11 | 141.79 ± 0.04 | 0.626 ± 0.003 | 0.449 ± 0.003 | 140.42 ± 0.04 | 144.61 ± 0.04 | 147.51 ± 0.04 |
| 143-2b | 119.2 ± 0.4 | 163.3 ± 0.5 | 44.1 ± 0.6 | 141.3 ± 0.3 | 142.50 ± 0.04 | 0.619 ± 0.007 | 0.443 ± 0.007 | 141.17 ± 0.05 | 145.21 ± 0.04 | 148.00 ± 0.04 |
| 143-3a | 120.2 ± 0.3 | 158.8 ± 0.4 | 38.6 ± 0.5 | 139.5 ± 0.2 | 140.51 ± 0.05 | 0.970 ± 0.008 | 0.539 ± 0.008 | 139.17 ± 0.05 | 143.28 ± 0.05 | 146.09 ± 0.05 |
| 143-3b | 119.88 ± 0.04 | 161.3 ± 1.0 | 41.4 ± 1.0 | 140.6 ± 0.5 | 141.63 ± 0.05 | 0.718 ± 0.012 | 0.457 ± 0.012 | 140.28 ± 0.05 | 144.41 ± 0.04 | 147.22 ± 0.04 |
| 143-4a | 118.7 ± 0.2 | 168.21 ± 0.03 | 49.5 ± 0.2 | 143.47 ± 0.12 | 142.71 ± 0.04 | 0.532 ± 0.002 | 0.324 ± 0.002 | 141.29 ± 0.05 | 145.61 ± 0.04 | 148.56 ± 0.04 |
| 143-4b | 119.0 ± 0.3 | 161.58 ± 0.04 | 42.6 ± 0.3 | 140.27 ± 0.14 | 142.19 ± 0.05 | 0.538 ± 0.003 | 0.339 ± 0.003 | 140.87 ± 0.05 | 144.87 ± 0.04 | 147.59 ± 0.04 |
| 143-5 | 119.9 ± 0.3 | 166.608 ± 0.016 | 46.7 ± 0.3 | 143.28 ± 0.16 | 144.24 ± 0.04 | 0.386 ± 0.002 | 0.305 ± 0.002 | 142.93 ± 0.04 | 146.86 ± 0.04 | 149.48 ± 0.03 |
| 143-6 | 119.97 ± 0.20 | 166.14 ± 0.04 | 46.2 ± 0.2 | 143.06 ± 0.10 | 143.00 ± 0.04 | 0.4531 ± 0.0016 | 0.3128 ± 0.0016 | 141.66 ± 0.05 | 145.72 ± 0.04 | 148.49 ± 0.04 |
| 143-7 | 120.39 ± 0.07 | 167.5 ± 0.3 | 47.1 ± 0.3 | 143.95 ± 0.15 | 144.46 ± 0.04 | 0.427 ± 0.002 | 0.308 ± 0.002 | 143.14 ± 0.05 | 147.09 ± 0.04 | 149.69 ± 0.04 |
| 143-8 | 120.7 ± 0.4 | 165.59 ± 0.06 | 44.8 ± 0.4 | 143.16 ± 0.18 | 143.55 ± 0.04 | 0.393 ± 0.002 | 0.277 ± 0.002 | 142.18 ± 0.05 | 146.30 ± 0.04 | 149.02 ± 0.04 |
| 143-avg | 119.994 ± 0.018 | 165.76 ± 0.04 | 45.76 ± 0.05 | 142.876 ± 0.018 | 142.710 ± 0.012 | 0.5069 ± 0.0007 | 0.3669 ± 0.0007 | 141.363 ± 0.012 | 145.458 ± 0.011 | 148.235 ± 0.011 |
| 143-detset1 | 120.05 ± 0.03 | 160.18 ± 0.09 | 40.13 ± 0.10 | 140.12 ± 0.05 | 141.45 ± 0.02 | 0.7049 ± 0.0017 | 0.4614 ± 0.0017 | 140.11 ± 0.02 | 144.22 ± 0.02 | 147.05 ± 0.02 |
| 143-detset2 | 118.95 ± 0.08 | 164.9 ± 0.8 | 45.9 ± 0.8 | 141.9 ± 0.4 | 142.27 ± 0.02 | 0.507 ± 0.007 | 0.379 ± 0.007 | 140.91 ± 0.02 | 145.05 ± 0.02 | 147.902 ± 0.019 |
| 143-SWBs | 120.17 ± 0.03 | 166.308 ± 0.018 | 46.14 ± 0.04 | 143.238 ± 0.017 | 143.96 ± 0.02 | 0.3967 ± 0.0006 | 0.3123 ± 0.0006 | 142.64 ± 0.02 | 146.63 ± 0.02 | 149.282 ± 0.020 |
| 217-1 | 189.0 ± 0.4 | 251.24 ± 0.05 | 62.2 ± 0.4 | 220.14 ± 0.20 | 222.817 ± 0.016 | 0.414 ± 0.002 | 0.322 ± 0.002 | 221.099 ± 0.016 | 226.274 ± 0.017 | 229.76 ± 0.02 |
| 217-2 | 188.66 ± 0.02 | 253.68 ± 0.02 | 65.03 ± 0.04 | 221.169 ± 0.017 | 223.231 ± 0.018 | 0.4575 ± 0.0004 | 0.3624 ± 0.0004 | 221.430 ± 0.018 | 226.814 ± 0.018 | 230.35 ± 0.02 |
| 217-3 | 190.49 ± 0.05 | 253.174 ± 0.018 | 62.68 ± 0.06 | 221.83 ± 0.03 | 223.116 ± 0.016 | 0.4125 ± 0.0004 | 0.3257 ± 0.0004 | 221.440 ± 0.017 | 226.458 ± 0.016 | 229.774 ± 0.019 |
| 217-4 | 190.8 ± 0.4 | 253.219 ± 0.017 | 62.4 ± 0.4 | 222.03 ± 0.18 | 222.717 ± 0.018 | 0.4043 ± 0.0018 | 0.3132 ± 0.0018 | 221.033 ± 0.018 | 226.116 ± 0.017 | 229.55 ± 0.02 |
| 217-5a | 182.69 ± 0.07 | 253.2 ± 0.6 | 70.5 ± 0.6 | 217.9 ± 0.3 | 220.421 ± 0.017 | 0.548 ± 0.003 | 0.387 ± 0.003 | 218.489 ± 0.018 | 224.293 ± 0.017 | 228.15 ± 0.02 |
| 217-5b | 182.75 ± 0.06 | 250.1 ± 0.4 | 67.3 ± 0.4 | 216.41 ± 0.19 | 220.655 ± 0.018 | 0.621 ± 0.002 | 0.377 ± 0.002 | 218.746 ± 0.018 | 224.465 ± 0.018 | 228.234 ± 0.020 |
| 217-6a | 182.284 ± 0.020 | 253.70 ± 0.02 | 71.41 ± 0.03 | 217.991 ± 0.014 | 220.619 ± 0.018 | 0.4497 ± 0.0003 | 0.3019 ± 0.0003 | 218.705 ± 0.018 | 224.441 ± 0.018 | 228.24 ± 0.02 |
| 217-6b | 182.85 ± 0.04 | 253.373 ± 0.015 | 70.52 ± 0.04 | 218.113 ± 0.019 | 220.619 ± 0.017 | 0.5274 ± 0.0004 | 0.3349 ± 0.0004 | 218.707 ± 0.017 | 224.408 ± 0.016 | 228.109 ± 0.017 |
| 217-7a | 188.217 ± 0.019 | 253.88 ± 0.02 | 65.66 ± 0.03 | 221.049 ± 0.012 | 220.766 ± 0.016 | 0.4299 ± 0.0003 | 0.3065 ± 0.0003 | 218.925 ± 0.016 | 224.458 ± 0.016 | 228.122 ± 0.018 |
| 217-7b | 189.22 ± 0.03 | 250.88 ± 0.02 | 61.66 ± 0.04 | 220.054 ± 0.018 | 220.332 ± 0.018 | 0.4371 ± 0.0003 | 0.2776 ± 0.0003 | 218.468 ± 0.018 | 224.055 ± 0.018 | 227.718 ± 0.019 |
| 217-8a | 181.98 ± 0.02 | 253.722 ± 0.018 | 71.74 ± 0.03 | 217.852 ± 0.013 | 220.510 ± 0.018 | 0.5282 ± 0.0003 | 0.3768 ± 0.0003 | 218.544 ± 0.019 | 224.432 ± 0.018 | 228.32 ± 0.02 |
| 217-8b | 181.875 ± 0.013 | 252.99 ± 0.04 | 71.12 ± 0.04 | 217.433 ± 0.018 | 220.712 ± 0.017 | 0.6265 ± 0.0004 | 0.3872 ± 0.0004 | 218.837 ± 0.018 | 224.440 ± 0.017 | 228.127 ± 0.020 |
| 217-avg | 188.892 ± 0.012 | 253.419 ± 0.007 | 64.527 ± 0.014 | 221.156 ± 0.006 | 221.915 ± 0.005 | 0.39900 ± 0.00013 | 0.33846 ± 0.00013 | 220.113 ± 0.005 | 225.517 ± 0.005 | 229.097 ± 0.006 |
| 217-detset1 | 183.32 ± 0.15 | 253.61 ± 0.02 | 70.29 ± 0.15 | 218.46 ± 0.07 | 220.548 ± 0.009 | 0.4577 ± 0.0007 | 0.3053 ± 0.0007 | 218.666 ± 0.010 | 224.312 ± 0.009 | 228.038 ± 0.010 |
| 217-detset2 | 182.159 ± 0.012 | 253.592 ± 0.008 | 71.433 ± 0.015 | 217.875 ± 0.007 | 220.614 ± 0.009 | 0.47458 ± 0.00016 | 0.34838 ± 0.00016 | 218.697 ± 0.009 | 224.429 ± 0.009 | 228.200 ± 0.010 |
| 217-SWBs | 189.02 ± 0.06 | 253.247 ± 0.014 | 64.22 ± 0.06 | 221.14 ± 0.03 | 222.957 ± 0.008 | 0.4072 ± 0.0003 | 0.3226 ± 0.0003 | 221.241 ± 0.008 | 226.395 ± 0.008 | 229.834 ± 0.010 |
| 353-1 | 306.3 ± 0.5 | 406.8 ± 0.4 | 100.5 ± 0.7 | 356.5 ± 0.3 | 360.289 ± 0.018 | 0.540 ± 0.003 | 0.390 ± 0.003 | 357.546 ± 0.018 | 365.762 ± 0.019 | 371.15 ± 0.02 |
| 353-2 | 305.82 ± 0.16 | 409.697 ± 0.020 | 103.88 ± 0.16 | 357.76 ± 0.08 | 360.866 ± 0.019 | 0.5947 ± 0.0008 | 0.4515 ± 0.0008 | 358.005 ± 0.019 | 366.615 ± 0.020 | 372.29 ± 0.02 |
| 353-3a | 308.5 ± 0.3 | 404.77 ± 0.03 | 96.3 ± 0.3 | 356.63 ± 0.13 | 359.59 ± 0.02 | 0.4106 ± 0.0008 | 0.2862 ± 0.0008 | 357.16 ± 0.02 | 364.49 ± 0.02 | 369.37 ± 0.02 |
| 353-3b | 308.3 ± 0.4 | 406.230 ± 0.015 | 98.0 ± 0.4 | 357.24 ± 0.19 | 359.65 ± 0.02 | 0.4689 ± 0.0014 | 0.3546 ± 0.0014 | 357.02 ± 0.02 | 365.01 ± 0.02 | 370.41 ± 0.02 |
| 353-4a | 321.275 ± 0.018 | 407.94 ± 0.11 | 86.66 ± 0.11 | 364.61 ± 0.06 | 362.224 ± 0.018 | 0.4334 ± 0.0004 | 0.3119 ± 0.0004 | 359.944 ± 0.017 | 366.853 ± 0.019 | 371.52 ± 0.02 |
| 353-4b | 311.71 ± 0.05 | 407.71 ± 0.03 | 96.00 ± 0.06 | 359.71 ± 0.02 | 362.212 ± 0.019 | 0.4152 ± 0.0003 | 0.3123 ± 0.0003 | 359.739 ± 0.019 | 367.22 ± 0.02 | 372.23 ± 0.02 |
| 353-5a | 302.25 ± 0.04 | 406.41 ± 0.15 | 104.17 ± 0.16 | 354.33 ± 0.08 | 358.73 ± 0.02 | 0.3991 ± 0.0005 | 0.2965 ± 0.0005 | 355.88 ± 0.02 | 364.42 ± 0.02 | 370.01 ± 0.02 |
| 353-5b | 301.37 ± 0.05 | 416.77 ± 0.05 | 115.40 ± 0.07 | 359.07 ± 0.03 | 358.84 ± 0.02 | 0.3626 ± 0.0002 | 0.2542 ± 0.0002 | 355.80 ± 0.02 | 364.98 ± 0.02 | 371.11 ± 0.03 |
| 353-6a | 302.4 ± 0.4 | 407.99 ± 0.03 | 105.6 ± 0.4 | 355.19 ± 0.19 | 359.91 ± 0.03 | 0.3036 ± 0.0007 | 0.1946 ± 0.0007 | 357.09 ± 0.03 | 365.58 ± 0.03 | 371.18 ± 0.03 |
| 353-6b | 314.08 ± 0.03 | 398.19 ± 0.04 | 84.11 ± 0.05 | 356.13 ± 0.02 | 356.06 ± 0.02 | 0.2990 ± 0.0002 | 0.2193 ± 0.0002 | 353.67 ± 0.02 | 360.93 ± 0.02 | 365.83 ± 0.03 |
| 353-7 | 323.2 ± 1.6 | 406.0 ± 0.9 | 83 ± 2 | 364.6 ± 0.7 | 363.35 ± 0.03 | 0.313 ± 0.006 | 0.272 ± 0.006 | 360.84 ± 0.03 | 368.40 ± 0.02 | 373.41 ± 0.03 |
| 353-8 | 309 ± 3 | 408.20 ± 0.08 | 99 ± 3 | 358.5 ± 1.7 | 365.10 ± 0.02 | 0.374 ± 0.011 | 0.294 ± 0.011 | 362.25 ± 0.02 | 370.82 ± 0.02 | 376.53 ± 0.04 |
| 353-avg | 306.8 ± 0.6 | 408.22 ± 0.02 | 101.4 ± 0.6 | 357.5 ± 0.3 | 361.290 ± 0.008 | 0.4057 ± 0.0019 | 0.3353 ± 0.0019 | 358.564 ± 0.008 | 366.764 ± 0.009 | 372.193 ± 0.010 |
| 353-detset1 | 303.582 ± 0.016 | 406.333 ± 0.018 | 102.75 ± 0.03 | 354.957 ± 0.011 | 359.156 ± 0.011 | 0.39123 ± 0.00015 | 0.29902 ± 0.00015 | 356.386 ± 0.011 | 364.744 ± 0.011 | 370.302 ± 0.012 |
| 353-detset2 | 318.885 ± 0.015 | 407.86 ± 0.02 | 88.97 ± 0.03 | 363.372 ± 0.013 | 360.870 ± 0.013 | 0.35915 ± 0.00014 | 0.28730 ± 0.00014 | 358.409 ± 0.013 | 365.850 ± 0.013 | 370.837 ± 0.013 |
| 353-SWBs | 306.3 ± 0.4 | 408.81 ± 0.03 | 102.5 ± 0.4 | 357.56 ± 0.18 | 361.921 ± 0.013 | 0.4381 ± 0.0013 | 0.3575 ± 0.0013 | 359.158 ± 0.013 | 367.455 ± 0.013 | 372.930 ± 0.015 |
| 545-1 | 466.41 ± 0.03 | 642.58 ± 0.05 | 176.17 ± 0.06 | 554.50 ± 0.03 | 559.83 ± 0.05 | 0.37600 ± 0.00018 | 0.29576 ± 0.00018 | 554.44 ± 0.07 | 570.00 ± 0.03 | 579.24 ± 0.02 |
| 545-2 | 466.78 ± 0.03 | 641.44 ± 0.07 | 174.66 ± 0.08 | 554.11 ± 0.04 | 556.05 ± 0.05 | 0.31937 ± 0.00019 | 0.26874 ± 0.00019 | 550.61 ± 0.07 | 566.37 ± 0.03 | 575.78 ± 0.03 |
| 545-3 | 470.6 ± 0.9 | 637.44 ± 0.05 | 166.9 ± 0.9 | 554.0 ± 0.4 | 557.40 ± 0.08 | 0.2536 ± 0.0011 | 0.2127 ± 0.0011 | 552.26 ± 0.13 | 567.14 ± 0.04 | 576.05 ± 0.03 |
| 545-4 | 470.9 ± 0.3 | 638.52 ± 0.10 | 167.6 ± 0.3 | 554.73 ± 0.16 | 556.85 ± 0.05 | 0.2630 ± 0.0004 | 0.2143 ± 0.0004 | 551.76 ± 0.08 | 566.48 ± 0.03 | 575.32 ± 0.02 |
| 545-avg | 469.5 ± 0.6 | 640.81 ± 0.03 | 171.3 ± 0.6 | 555.2 ± 0.3 | 557.53 ± 0.03 | 0.3036 ± 0.0008 | 0.2612 ± 0.0008 | 552.22 ± 0.04 | 567.596 ± 0.016 | 576.778 ± 0.014 |
| 545-detset1 | 466.44 ± 0.02 | 642.36 ± 0.04 | 175.91 ± 0.05 | 554.40 ± 0.02 | 557.86 ± 0.03 | 0.32548 ± 0.00013 | 0.28031 ± 0.00013 | 552.43 ± 0.05 | 568.118 ± 0.020 | 577.458 ± 0.018 |
| 545-detset2 | 470.9 ± 0.3 | 638.52 ± 0.09 | 167.6 ± 0.3 | 554.73 ± 0.18 | 556.85 ± 0.05 | 0.2631 ± 0.0004 | 0.2143 ± 0.0004 | 551.76 ± 0.08 | 566.48 ± 0.03 | 575.32 ± 0.02 |
| 857-1 | 748.7 ± 0.9 | 992.5 ± 0.3 | 243.8 ± 1.0 | 870.6 ± 0.5 | 866.05 ± 0.10 | 0.2595 ± 0.0010 | 0.2283 ± 0.0010 | 858.1 ± 0.3 | 880.89 ± 0.03 | 894.38 ± 0.03 |
| 857-2 | 726.3 ± 0.4 | 989.09 ± 0.13 | 262.8 ± 0.4 | 857.7 ± 0.2 | 860.55 ± 0.08 | 0.2435 ± 0.0003 | 0.1973 ± 0.0003 | 852.28 ± 0.19 | 876.22 ± 0.03 | 890.59 ± 0.03 |
| 857-3 | 742.0 ± 0.5 | 991.7 ± 1.4 | 249.7 ± 1.5 | 866.8 ± 0.7 | 864.92 ± 0.09 | 0.2888 ± 0.0015 | 0.2573 ± 0.0015 | 857.0 ± 0.2 | 879.90 ± 0.03 | 893.53 ± 0.03 |
| 857-4 | 731.4 ± 0.4 | 979.9 ± 0.2 | 248.4 ± 0.4 | 855.7 ± 0.2 | 854.75 ± 0.09 | 0.1414 ± 0.0002 | 0.1189 ± 0.0002 | 847.2 ± 0.2 | 868.94 ± 0.03 | 881.94 ± 0.03 |
| 857-avg | 743.9 ± 0.5 | 989.78 ± 0.08 | 245.9 ± 0.5 | 866.8 ± 0.3 | 862.68 ± 0.05 | 0.2412 ± 0.0005 | 0.2165 ± 0.0005 | 854.69 ± 0.11 | 877.724 ± 0.017 | 891.462 ± 0.014 |
| 857-detset1 | 736.9 ± 0.3 | 990.38 ± 0.06 | 253.4 ± 0.3 | 863.65 ± 0.13 | 863.42 ± 0.07 | 0.2446 ± 0.0002 | 0.2121 ± 0.0002 | 855.33 ± 0.16 | 878.67 ± 0.02 | 892.59 ± 0.02 |
| 857-detset2 | 741.79 ± 0.14 | 987.01 ± 0.09 | 245.22 ± 0.18 | 864.40 ± 0.08 | 861.74 ± 0.08 | 0.23780 ± 0.00017 | 0.21419 ± 0.00017 | 853.89 ± 0.18 | 876.53 ± 0.03 | 890.03 ± 0.03 |
File containing table of detector coefficients and band-average coefficients[edit]
File:HFI_UcCC_v307_withMaskData.gz
References[edit]
- ↑ Jump up to: 1.01.11.2 Planck 2013 results. IX. HFI spectral response, Planck Collaboration, 2014, A&A, 571, A9.
(Planck) High Frequency Instrument
reduced IMO
Cosmic Microwave background