Planck high dynamic range colour palette
We are displaying the microwave frequency maps over the frequency span of 22-353 GHz. Our principal target --- the CMB anisotropy --- is a muti-scale signal of a typical amplitude range of . Superposed on that is the instrumental noise that ranges from typical amplitudes similar to the CMB anisotropy, or even larger, in the noisy channels (radiometers in WMAP and LFI), and considerably smaller, of order , in bolometric channels of HFI. Further, the foreground emission in the bright parts of the Galaxy reaches well into the miliK range. An effective display of such large dynamic range of signal via colour rendering in the 8-bit RGB colour scheme is a daunting task. Linear colour scale never can render all of these signal regimes simultaneously in a satisfying way. Logarithmic colour scale suffers from the obvious limitation due to positive/negative signature of the CMB anisotropy, and commonly available histogram equalization scheme is difficult to standardize against multifrequency data where the dynamic range of signal varies considerably from channel to channel, precisely as in the case at hand.
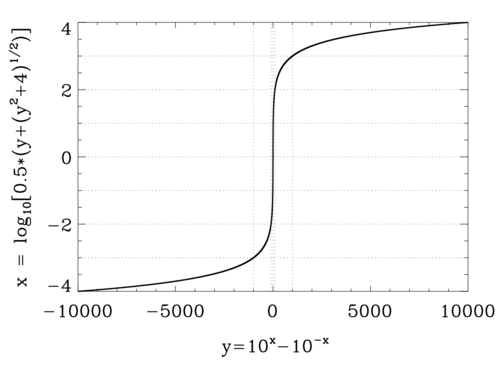
We have employed a new approach that meets the requirement of effective simultaneous display of all data of interest (including all 22 to 353 GHz sky maps) via a universal mathematical mapping of pixel temperature values to a special purpose colour scheme. The pixel temperature transformation is based on inversion or the function , that is . This function is shown in the figure below. This definition results in a functional analogon to , based on decimal logarithm. Its advantages include natural and symmetric handling of positive and negative values, logarithmic suppression of the high dynamic range of signal values, easy read-off in of the pixel temperature values, and liner transition through zero values of the scale. The particular colour scheme chosen to merge with this temperature scale transformation is shown in the panel figures of the sky maps. The resulting display is remarkably effective in simultaneous colour display of vastly different amplitude ranges of sky signal.
Cosmic Microwave background
(Planck) Low Frequency Instrument
(Planck) High Frequency Instrument
