HFI reference bolometer
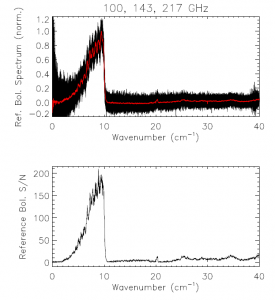
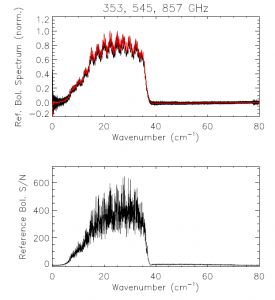
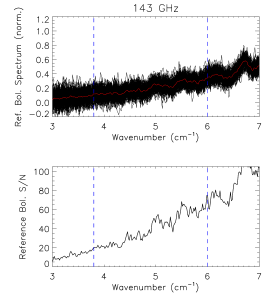
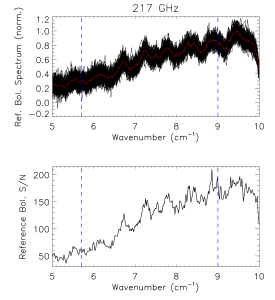
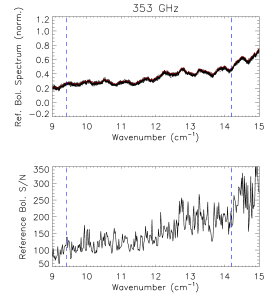
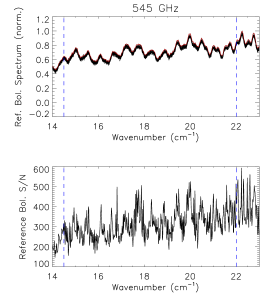
This sections provides information on the reference bolometer interferograms and spectra used in determining the relative spectral response functions for the Planck HFI detectors and frequency bands.
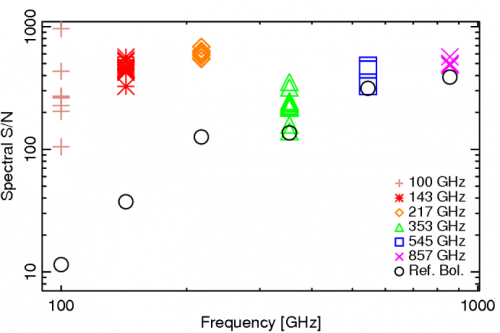
| Band [GHz] | No. Ifgm. | No. Spec. | MPD (cm) | ILS FWHM [cm-1) | avg. S/N |
| 100 | 164 | 164 | 29.644698 | 0.020357772 | 11.478057 |
| 143 | 164 | 164 | 29.644698 | 0.020357772 | 37.361317 |
| 217 | 164 | 164 | 29.644698 | 0.020357772 | 126.14280 |
| 353 | 24 | 24 | 29.652306 | 0.020352549 | 136.06159 |
| 545 | 24 | 24 | 29.652306 | 0.020352549 | 314.58093 |
| 857 | 24 | 24 | 29.652306 | 0.020352549 | 388.23050 |
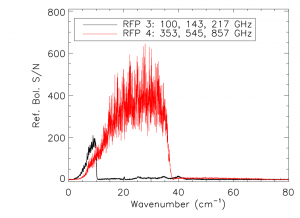
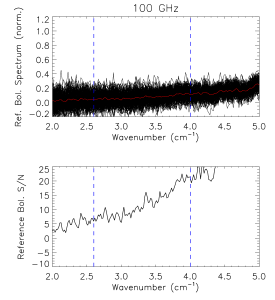
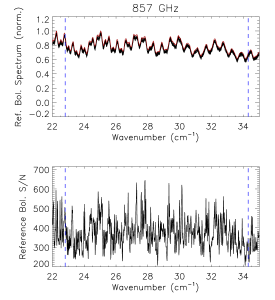
Reference bolometer spectra and S/N.
Reference bolometer spectra (top) and S/N (bottom) for each of the HFI bands (vertical dashed lines represent band edges).
(Planck) High Frequency Instrument
Instrument Line Shape
Full-Width-at-Half-Maximum
