Additional maps
Contents
Overview[edit]
This section describes products that require special processing. Only one such product is available at this time; this section will be expanded with time as more products are added.
Lensing map[edit]
Description[edit]
Here we present the minimum-variance (MV) lens reconstruction which forms the basis for the main results of #planck2013-p12. This map is produced using a combination of the 143 and 217 GHz Planck maps on approximately 70% of the sky, and is the same map on which the Planck lensing likelihood is based.
We distribute:
- PHIBAR
- A (transfer-function convolved) map of the lensing potential, in NSIDE 2048 HEALPix RING format. It is obtained by convolving the lensing potential estimate with the lensing response function . This map has been band-limited between multipoles .
- MASK
- This is a NSIDE = 2048 HEALPix map, containing the analysis mask used in the lens reconstruction. Note: the lensing map PHIBAR may take small but non-zero values inside the masked regions because it has been bandlimited.
- RLPP
- This column contains the response function .
- NLPP
- This column contains a sky-averaged estimate of the noise power spectrum of PHIBAR, . The noise is highly coloured. There is a dependence of the noise power spectrum on the local noise level of the map, discussed in Appendix A of #planck2013-p12. Note that the noise power spectrum estimate here is not sufficiently accurate for a power spectrum analysis.
Also, the table below gives the lensing curl-mode power spectrum data used to produce Figure A2 of #planck2013-p12:
| min | max | ||
|---|---|---|---|
| 2 | 7 | -13.6379 | 15.3409 |
| 8 | 20 | 6.0184 | 4.8881 |
| 21 | 39 | -1.0675 | 3.0940 |
| 40 | 65 | 0.6135 | 1.8474 |
| 66 | 100 | 1.5030 | 1.2696 |
| 101 | 144 | 1.3760 | 0.9950 |
| 145 | 198 | -1.2289 | 0.8286 |
| 199 | 263 | 1.1910 | 0.7001 |
| 264 | 338 | -0.6567 | 0.6197 |
| 339 | 425 | -0.8201 | 0.5235 |
| 426 | 525 | -0.7581 | 0.4850 |
| 526 | 637 | -0.3201 | 0.5134 |
| 638 | 762 | -0.1589 | 0.4073 |
| 763 | 901 | -0.6451 | 0.4044 |
| 902 | 1054 | 0.4910 | 0.3718 |
| 1055 | 1221 | -0.2186 | 0.3702 |
| 1222 | 1404 | -0.3295 | 0.4146 |
| 1405 | 1602 | -0.3647 | 0.4703 |
| 1603 | 1816 | -0.1060 | 0.5904 |
| 1817 | 2020 | -0.7887 | 0.8507 |
Production process[edit]
The construction PHIBAR, RLPP and NLPP are described in detail in Sec. 2.1 of #planck2013-p12. The response function here is analogous to the the beam transfer function in a CMB temperature or polarization map. We have chosen to distribute this transfer-function convolved map rather than the normalized lens reconstruction as it is a significantly more localized function of the CMB temperature map from which it is derived, and therefore more useful for cross-correlation studies.
Inputs[edit]
This product is built from the 143 and 217 GHz Planck frequency maps, with 857GHz projected out as a dust template. The analysis mask is constructed from a combination of thresholding in the 857GHz map (to remove the regions which are most contaminated by Galactic dust) and the Type2 CO map (to reduce contamination from CO lines at 217GHz). This is joined with a compact object mask synthesized from several Planck source catalogues, including the ERCSC, SZ and PCCS . The reconstruction was performed using the fiducial beam window functions B(l) from the HFI RIMO . Details of the procedure used to produce a lensing estimate from these inputs are given in #planck2013-p12.
File names and format[edit]
A single file named
with two BINTABLE extensions containing the items described below.
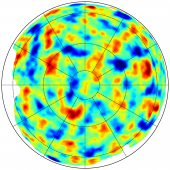
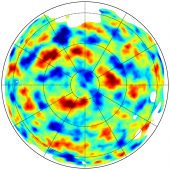
For illustration, we show in the figures below the maps of the Wiener-filtered CMB lensing potential in Galactic coordinates using orthographic projection. The reconstruction was bandpass filtered to . Note that the lensing reconstruction, while highly statistically significant, is still noise dominated for every individual mode, and is at best around .
| 1. EXTNAME = LENS-MAP | ||||
|---|---|---|---|---|
| Column Name | Data Type | Units | Description | |
| PHIBAR | Real*4 | none | Map of the lensing potential estimate, convolved with RLPP | |
| MASK | Int | none | Region over which the lensing potential is reconstructed | |
| Keyword | Data Type | Value | Description | |
| PIXTYPE | string | HEALPIX | ||
| COORDSYS | string | GALACTIC | Coordinate system | |
| ORDERING | string | NESTED | Healpix ordering | |
| NSIDE | Int*4 | 2048 | Healpix Nside | |
| FIRSTPIX | Int*4 | 0 | ||
| LASTPIX | Int*4 | 50331647 | ||
| 2. EXTNAME = TransFun | ||||
| Column Name | Data Type | Units | Description | |
| RLPP | Real*4 | none | Response function | |
| NLPP | Real*4 | none | Sky-averaged noise power spectrum estimate | |
| Keyword | Data Type | Value | Description | |
| L_MIN | Int*4 | 0 | First multipole | |
| L_MAX | Int*4 | 2048 | Last multipole | |
IRAM Maps of the Crab nebula[edit]
Maps of the Crab nebula at 89.189 GHz (HCO+(1-0) transition) in both temperature and polarization, prodouced from observations performed at the IRAM 30m telescope from January 9th to January 12th 2009, are delivered as a tarball of 416 KB in the file
See README in the tarball for full details. These data were used in #Aumont2010
References[edit]
<biblio force=false>
</biblio>
(Hierarchical Equal Area isoLatitude Pixelation of a sphere, <ref name="Template:Gorski2005">HEALPix: A Framework for High-Resolution Discretization and Fast Analysis of Data Distributed on the Sphere, K. M. Górski, E. Hivon, A. J. Banday, B. D. Wandelt, F. K. Hansen, M. Reinecke, M. Bartelmann, ApJ, 622, 759-771, (2005).
Cosmic Microwave background
Flexible Image Transfer Specification

