2015 CMB spectra
General description
TT
The Planck best-fit CMB temperature power spectrum, shown in the figure below, covers the wide range of multipoles ℓ = 2-2508. Over the multipole range ℓ = 2-29, the power spectrum is derived from the "Commander" component-separation algorithm applied to the combination of Planck 2015 temperature data between 30 and 857 GHz, the 9-year WMAP sky maps, and the 408-MHz Haslam et al. (1982) survey, including 93% of the sky (Planck-2015-A10[4]). The asymmetric error bars associated with this spectrum are the 68% confidence limits and include the uncertainties due to foreground subtraction.
For multipoles equal or greater than ℓ = 30, instead, the spectrum is derived from the "Plik" likelihood Planck-2015-A11[5] by optimally combining the spectra in the frequency range 100-217 GHz, and correcting them for unresolved foregrounds using the best-fit foreground solution from a Planck TT+lowP ΛCDM run. Associated 1σ errors include beam uncertainties. Both Commander and Plik are described in more detail in the sections below.
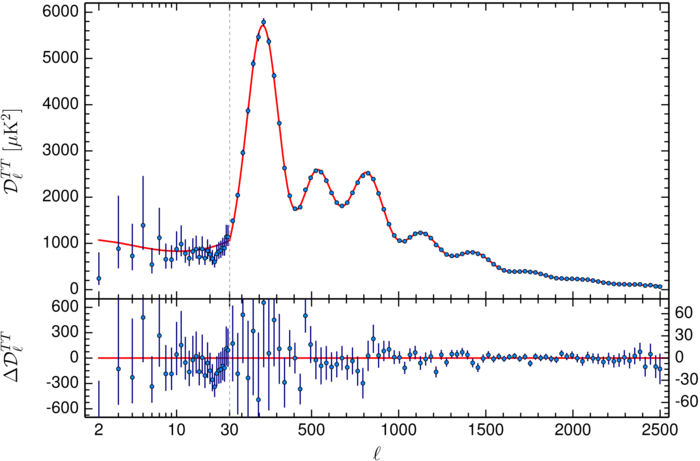
Planck 2015 TT power spectrum. The x-axis is logarithmic up to ℓ = 30 and linear at higher ℓ. The red line is the Planck best-fit primordial power spectrum (cf. Planck TT+lowP in table 3 of Planck-2015-A15[3]). Residuals with respect to this model are shown in the lower panel. The error bars show ±1σ uncertainties. TE, EE, and TB, EB, BB
The Planck best-fit CMB polarization and temperature-polarization cross-correlation power spectra, shown in the figure below, cover the multipole range ℓ = 2-1996. The data points relative to the multipole range ℓ = 2-29 are quadratic maximum likelihood (QML) estimates from foreground-cleaned Planck 70-GHz Q and U Stokes parameter maps using 46% of the sky (the same maps that are used in the "lowP" likelihood, see Planck-2015-A11[5]). In the range ℓ = 2-29, we also release the BB, TB, and EB power spectra derived from the same maps (for the cross-spectra involving temperature, the Commander map is always used). Symmetric error bars are given as the 68% confidence intervals as derived from the Fisher information matrix of the estimates.
Analogously to the TT case, the ℓ ≥ 30 spectrum is derived from the Plik likelihood Planck-2015-A11[5] by optimally combining the spectra in the frequency range 100-217 GHz, and correcting them for unresolved foregrounds using the best-fit foreground solution from a Planck TT,TE,EE+lowP ΛCDM run.
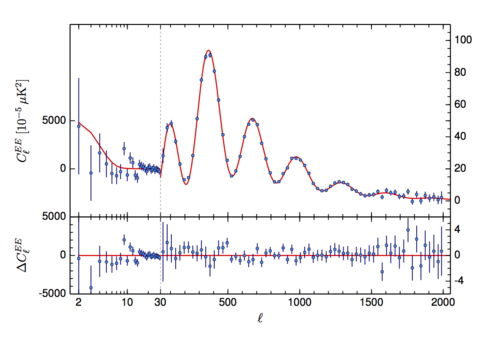 Planck 2015 EE power spectrum. The red line is the Planck best-fit primordial power spectrum (cf. Planck TT+lowP in table 3 of Planck-2015-A13[6]). Residuals with respect to this model are shown in the lower panel. The error bars show ±1σ uncertainties. |
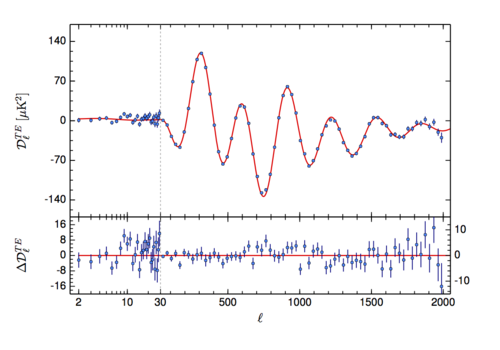 Planck 2015 TE power spectrum. The red line is the Planck best-fit primordial power spectrum (cf. Planck TT+lowP in table 3 of Planck-2015-A13[6]). Residuals with respect to this model are shown in the lower panel. The error bars show ±1σ uncertainties. |
Production process
The ℓ < 30 part of the Planck TT power spectrum is derived from the Commander approach, which implements Bayesian component separation in pixel space, fitting a parametric model to the data by sampling the posterior distribution for the model parameters (Planck-2015-A10[4]). The power spectrum at any multipole ℓ is given as the maximum probability point for the posterior Cℓ distribution, marginalized over the other multipoles, and the error bars are from the 68% confidence level; see Planck-2015-A10[4]. The polarization spectra (EE, TE, BB, TB, EB) are estimated from maps of the Planck 70 GHz channel, cleaned from polarized synchrotron emission using the 30 GHz channel as a template and from polarized dust emission using the 353 GHz channel; see Sect.2 of Planck-2015-A11[5] for details about the foreground cleaning procedure. The pixel-pixel (map level) noise covariance matrix has been estimated from the timelines and corrected to account for foreground cleaning. The QML code Bolpol has been used to estimate the power spectra and their Fisher matrix from the cleaned map and covariance matrix, after imposing a Galactic mask that makes 43% of the full sky available to analysis (see again Planck-2015-A11[5]). The symmetric 68% error bars have been derived from the resulting Fisher matrix and include contributions from cosmic variance, noise, and foreground associated errors.
The ℓ ≥ 30 part of the TT, TE, and EE power spectra have been derived by the Plik likelihood, a code that implements a pseudo-Cℓ based technique, extensively described in section 2.2 and the appendix of Planck-2013-XV[7], and more recently in Planck-2015-A11[5]. Frequency spectra are computed as cross-spectra between half-mission maps. Mask and multipole range choices for each frequency spectrum are summarized in section 3.3 of Planck-2015-A13[6] and in Planck-2015-A11[5]. The final power spectrum is an optimal combination of the 100, 143, 143×217, and 217 GHz spectra, corrected for the best-fit unresolved foregrounds and inter-frequency calibration factors, as derived from the full likelihood analysis (for TT we use the best-fit solutions for the nuisance parameters from the Planck+TT+lowP data combination, while for TE and EE we use the best fit from Planck+TT+lowP, cf. table 3 of Planck-2015-A13[6]). A thorough description of the models of unresolved foregrounds is given in Planck-2015-A11[5]. The spectrum covariance matrix accounts for cosmic variance and noise contributions, together with beam uncertainties. The ℓ ≥ 30 CMB TT spectrum and associated covariance matrix are available in two formats.
- Unbinned: TT, 2479 bandpowers (ℓ = 30-2508); TE or EE, 1697 bandpowers (ℓ = 30-1996).
- Binned, in bins of Δℓ = 30: TT, 83 bandpowers; TE or EE, 66 bandpowers.
We bin the Cℓ power spectrum with a weight proportional to ℓ(ℓ+1), so that the Cℓb binned bandpower centred on ℓb is
\\ C_{\ell_b}=\Sigma_{\ell \in b} w_{\ell_b\ell} C_\ell, \quad \text{with} \quad w_{\ell_b\ell}=\frac{\ell (\ell+1)}{\Sigma_{\ell \in b} \ell (\ell+1)}.\\
Equivalently, using the matrix formalism, we can construct the binning matrix B as
\\ B_{\ell_b \ell}=w_{\ell_b\ell}, \\
where B is an nb×nℓ matrix, with nb=83 being the number of bins and nℓ=2479 the number of unbinned multipoles. Thus
\\ {\bf C}_\mathrm{binned}=B \, {\bf C}, \\
\mathrm{cov_\mathrm{binned}}= B\, \mathrm{cov}\, B^{\rm T}, \\
\ell_b=B\, \ell .\\
Here, {\bf C}_{\rm binned}\, ({\bf C}) is the vector containing all the binned (unbinned) Cℓ bandpowers, \mathrm{cov} is the covariance matrix, and ℓb is the weighted average multipole in each bin. Note that following this definition, ℓb can be a non-integer. The binned Dℓb power spectrum is then calculated as
\\ D_{\ell_b}=\frac{\ell_b (\ell_b+1)}{2\pi} C_{\ell_b}.
Inputs
- Low-ℓ spectrum (ℓ<30):
- Planck 30 and 44 GHz frequency maps;
- Planck 70 to 857 GHz detector and detector-set maps;
- 9-year WMAP temperature sky maps between 23 and 94 GHz;
- 408-MHz survey of Haslam et al. (1982);
- Commander χ2-based LM93 confidence mask (Planck-2015-A10[4]).
- High-ℓ spectrum (30≤ℓ≤2508):
File names and meta-data
The CMB spectra and their uncertainties are distributed in a single multi-extension FITS file named COM_PowerSpect_CMB_R2.nn.fits.
- R2.00 contains (unbinned) TT spectra for low ℓ and TT, TE and EE spectra at high ℓ, both binned and unbinned (7 extensions).
- R2.01 corrects a small error in the effective ℓ of the bin of the binned data, which was truncated to an integer. Since these are weighted averages of the ℓ's used in a particular bin, they should be a reals.
- R2.02 contains low ℓ *E and *B spectra in addition to the TT spectra (5 additional extensions for a total of 12 extensions).
Further details on the data columns are given below (the extension numbers correspond to the R2.02 release).
- 1. TT low-ℓ, unbinned (TTLOLUNB)
- with the low-ℓ part of the spectrum, not binned, and for ℓ=2-29. The table columns are:
- ELL (integer), multipole number;
- D_ELL (float), Dℓ as described above;
- ERRUP (float), the upward uncertainty;
- ERRDOWN (float), the downward uncertainty.
- 2. TE low-ℓ, unbinned (TTLOLUNB)
- with the low-ℓ part of the spectrum, not binned, and for ℓ=2-29. The table columns are:
- ELL (integer), multipole number;
- D_ELL (float), Dℓ as described above;
- ERRUP (float), the upward uncertainty;
- ERRDOWN (float), the downward uncertainty.
- 3. EE low-ℓ, unbinned (TTLOLUNB)
- with the low-ℓ part of the spectrum, not binned, and for ℓ=2-29. The table columns are:
- ELL (integer), multipole number;
- D_ELL (float), Dℓ as described above;
- ERRUP (float), the upward uncertainty;
- ERRDOWN (float), the downward uncertainty.
- 4. TB low-ℓ, unbinned (TTLOLUNB)
- with the low-ℓ part of the spectrum, not binned, and for ℓ=2-29. The table columns are:
- ELL (integer), multipole number;
- D_ELL (float), Dℓ as described above;
- ERRUP (float), the upward uncertainty;
- ERRDOWN (float), the downward uncertainty.
- 5. EB low-ℓ, unbinned (TTLOLUNB)
- with the low-ℓ part of the spectrum, not binned, and for ℓ=2-29. The table columns are:
- ELL (integer), multipole number;
- D_ELL (float), Dℓ as described above;
- ERRUP (float), the upward uncertainty;
- ERRDOWN (float), the downward uncertainty.
- 6. BB low-ℓ, unbinned (TTLOLUNB)
- with the low-ℓ part of the spectrum, not binned, and for ℓ=2-29. The table columns are:
- ELL (integer), multipole number;
- D_ELL (float), Dℓ as described above;
- ERRUP (float), the upward uncertainty;
- ERRDOWN (float), the downward uncertainty.
- 7. TT high-ℓ, binned (TTHILBIN)
- with the high-ℓ part of the spectrum, binned into 83 bins covering 〈ℓ〉= 47-2499 in bins of width ℓ=30 (with the exception of the last bin that is smaller). The table columns are:
- ELL (float), mean multipole number of bin;
- L_MIN (integer), lowest multipole of bin;
- L_MAX (integer), highest multipole of bin;
- D_ELL (float), Dℓ as described above;
- ERR (float), the uncertainty.
- 8. TT high-ℓ unbinned (TTHILUNB)
- with the high-ℓ part of the spectrum, unbinned, in 2979 bins covering 〈ℓ〉= 30-2508. The table columns are:
- ELL (integer), multipole;
- D_ELL (float), Dℓ as described above;
- ERR (float), the uncertainty.
- 9. TE high-ℓ, binned (TEHILBIN)
- with the high-ℓ part of the spectrum, binned into 83 bins covering 〈ℓ〉= 47-1988 in bins of width ℓ=30 (with the exception of the last bin that is smaller). The table columns are:
- ELL (float), mean multipole number of bin;
- L_MIN (integer), lowest multipole of bin;
- L_MAX (integer), highest multipole of bin;
- D_ELL (float), Dℓ as described above;
- ERR (float), the uncertainty.
- 10. TE high-ℓ, unbinned (TEHILUNB)
- with the high-ℓ part of the spectrum, unbinned, in 2979 bins covering 〈ℓ〉= 30-1996. The table columns are:
- ELL (integer), multipole;
- D_ELL (float), Dℓ as described above;
- ERR (float), the uncertainty.
- 11. EE high-ℓ, binned (EEHILBIN)
- with the high-ℓ part of the spectrum, binned into 83 bins covering 〈ℓ〉= 47-1988 in bins of width ℓ=30 (with the exception of the last bin that is smaller). The table columns are:
- ELL (float), mean multipole number of bin;
- L_MIN (integer), lowest multipole of bin;
- L_MAX (integer), highest multipole of bin;
- D_ELL (float), Dℓ as described above;
- ERR (float), the uncertainty.
- 12. EE high-ℓ, unbinned (EEHILUNB)
- with the high-ℓ part of the spectrum, unbinned, in 2979 bins covering 〈ℓ〉= 30-1996. The table columns are:
- ELL (integer), multipole;
- D_ELL (float), Dℓ as described above;
- ERR (float), the uncertainty.
The spectra give Dℓ = ℓ(ℓ+1)Cℓ / 2π in units of μK2. The covariance matrices of the spectra will be released at a later time.
The CMB spectra are also given in seven simple text files, corresponding to each of the FITS file BINTABLE extensions described above.
Likelihood
The 2015 baseline likelihood release consists of a code package and a single data package. Four extended data packages are also available enabling exploration of alternatives to the baseline results.
The code compiles to a library allowing for the computation of log likelihoods for a given data set. Each data package contains multiple data sets. A data set permits the computation of a single likelihood among:
- the high-ℓ temperature and polarization CMB (jointly or separately);
- the low-ℓ temperature and polarization CMB (jointly or separately);
- the CMB lensing reconstruction.
By combining the results from different data sets (possibly from different data packages), one can compute the likelihood of different subsets of the Planck data.
Only the baseline data package, COM_Likelihood_Data-baseline_R2.00.tar.gz, will be fully described on this page. It contains six data sets, which are enough to compute all of the baseline Planck results that are discussed in Planck-2015-A12[9]. In particular it allows for the computation of the CMB and lensing likelihood from either the Temperature data only, or the Temperature + Polarization combination.
The other data packages contain data sets that extend the baseline results, enabling the exploration of different regimes, which are discussed in Planck-2015-A11[5] and Planck-2015-A15[10]. Their full description is contained in the documentation included in each of the extended data packages.
Library and tools
Description
The library consists of code written in C and Fortran 90. It can be called from both of
those languages. Optionally, a python wrapper can be built as well. Scripts to
simplify the linking of the library with other codes are part of the package, as
well as some example codes that can be used to test the correct installation of
the code and the integrity of the data packages. Optionally, a script is also available, allowing
the user to modify the multipole range of the TT likelihoods and reproduce the hybridization
test performed in the paper.
A description of the tool, the API of the library, as well as different
installation procedure are detailed in the readme.md file in the code package.
File name
The code can be extracted from
COM_Likelihood_Code-v2.0_R2.00.tar.bz2.
Please read the file readme.md for installation instructions.
Data sets - Baseline data
All of the released baseline data are distributed within a single file,
COM_Likelihood_Data-baseline_R2.00.tar.gz.
This file extracts to a directory hierarchy, containing the different data sets needed to compute different likelihoods.
Each data set is stored in its own directory. The directory structure follows similar rules
for each data set, and stores data, template, and meta-data for each particular likelihood.
As in 2013, the CMB likelihood is cut into low-ℓ and high-ℓ parts. Moreover,
for each of those, we distribute both a T-only datafile and a joint T+P one. In the case
of the high-ℓ part, we also distribute two specific versions of the likelihood,
that allow for estimate of T and T+P marginalized over the nuisance parameters.
Combining both the low-ℓ and high-ℓ files, one can compute the likelihood over the
range ℓ=2-2508 in TT and ℓ=2-1996 in TE and EE. A full description of the low-ℓ
and high-ℓ likelihood is available in Planck-2015-A11[5].
Similarly, for the case of lensing, we also distribute the likelihood using both
the reconstruction based on the T map only, or on T+P maps.
A full description of the lensing likelihood is available in Planck-2015-A15[10].
All of the likelihood files have at least one nuisance parameter, allowing users to investigate the Planck absolute calibration. We recommend that his parameter is explored in the Gaussian prior 1.0000±0.0025.
Low-ℓ likelihoods
TT only - commander
This file allows for the computation of the CMB TT likelihood in the range ℓ=2-29.
Using the optional tool in the code package, it can be modified to cover any multipole range
up to ℓ<200.
Production process
The likelihood is based on the results of the Commander approach, which implements a
Bayesian component separation method in pixel space, sampling the posterior distribution
of the parameters of a model that describes both the CMB and the foreground emissions
in a combination of the Planck maps, the WMAP map, and the 408-MHz survey. The samples
of this exploration are used to infer the foreground marginalized low-ℓ likelihood
for any TT CMB spectrum.
Inputs:
- Planck 30- and 44-GHz frequency maps;
- Planck 70- to 857-GHz detector and detector-set maps;
- 9-year WMAP temperature sky maps between 23 and 94 GHz;
- 408-MHz survey of Haslam et al. (1982);
- Commander χ2-based LM93 confidence mask (Planck-2015-A10[4]).
File name and usage
The commander likelihood is distributed in
plc_2.0/low_l/commander/commander_rc2_v1.1_l2_29_B.clik
When used with the library, this expects a vector of parameters consisting of the
TT CMB power spectrum from ℓ=0 to 29 (inclusive) and an extra nuisance parameter
consisting of the overall Planck calibration. Note that the vector really starts at ℓ=0, although
the first two entries are null.
TEB
This file allows for the computation of the CMB joint TT,EE, BB and TE likelihood
in the range ℓ=2-29. It should not be used with the low-ℓ TT-only likelihood.
Production process
The file allows for the computation of the pixel based likelihood of T, E, and B
maps. The T map is the best-fit map obtained from the commander algorithm, as described above,
while the E and B maps are obtained from the 70GHz LFI full mission data, but excluding the second and fourth surveys. Foreground contamination is
dealt with by marginalizing over templates based on the 30-GHz LFI and 353-GHz HFI maps.
The covariance matrix comes from the Planck detector sensitivity modulated on the
sky by the scanning strategy. The covariance matrix is further enlarged to account
for the foreground template removal.
To speed up the computation by about an order of magnitude, the problem is
projected into Cℓ space using the Sherman-Morrison-Woodbury identity. Only the
projected quantities are stored in the data package.
Inputs:
- Planck 30- and 44-GHz frequency maps;
- Planck 70- to 857-GHz detector and detector-set maps;
- 9-year WMAP temperature sky maps between 23 and 94 GHz;
- 408-MHz survey of Haslam et al. (1982);
- Commander χ2-based LM93 confidence mask Planck-2015-A10[4].
File name and usage
The low ell TEB likelihood is distributed in
plc_2.0/low_l/bflike/lowl_SMW_70_dx11d_2014_10_03_v5c_Ap.clik.
When used with the library, this expects a vector of parameters consisting of the
TT CMB power spectrum from ℓ=0 to 29 (inclusive), followed by the EE (ℓ=0 to 29),
BB (ℓ=0 to 29) and TE (ℓ=0 to 29) spectra, and by an extra nuisance parameter
consisting of the overall Planck calibration. Note that the entries really start at ℓ=0, although the
ℓ=0 and ℓ=1 values will be null.
High-ℓ likelihoods
TT only - Plik
This file allows for the computation of the CMB TT likelihood in the range ℓ=30-2508.
Using the optional tool in the code package it can be modified to cover any multipole range within 29<ℓ<2509.
Production process
The file contains the 100-GHz, 143-GHz, and 217-GHz binned half-mission TT cross-spectra.
Only the 100×100, 143×143, 143×217, and 217×217 spectra are actually used. Masks and multipole
ranges for each spectrum are different and described in Planck-2015-A11[5].
Masks are based on the CMB-cleaned 353-GHz map for the dust component, on the Planck catalogues for the point source part, and on the CO maps.
The file also contains
templates for the residual foreground contamination of each spectrum. The templates are needed
to allow for computation of the joint CMB and nuisance likelihood. The covariance matrix is
computed using an analytical approximation, and corrected for the effect of point sources through Monte Carlo estimates.
The covariance matrix is computed for a fiducial
cosmology and nuisance model that has been obtained using a first, less optimal estimate of the parameters.
Inputs:
- Planck 100-, 143-, and 217-GHz half-mission T maps;
- CMB-cleaned (using the SMICA map) 353-GHz map, CO emission maps, and Planck catalogues for the masks;
- Planck 545-GHz maps for the dust residual contamination template;
- CIB, tSZ, kSZ, and CIB×SZ templates.
File name and usage
The high-ℓ, Plik TT likelihood is distributed in
plc_2.0/hi_l/plik/plik_dx11dr2_HM_v18_TT.clik.
When used with the library, this expects a vector of parameters consisting of the
TT CMB power spectrum from ℓ=0 to 2508 (inclusive), followed by a vector of 16 nuisance parameters.
Those are, in order:
- A_cib_217, the CIB contamination at ℓ=3000 in the 217-GHz Planck map;
- cib_index, the effective slope of the CIB spectrum, a parameter that should be set to -1.3;
- xi_sz_cib, the SZ×CIB cross-correlation;
- A_sz, the tSZ contamination at 143GHz;
- ps_A_100_100, the point source contribution in 100×100;
- ps_A_143_143, the point source contribution in 143×143;
- ps_A_143_217, the point source contribution in 143×217;
- ps_A_217_217, the point source contribution in 217×217;
- ksz_norm, the kSZ contamination;
- gal545_A_100, the dust residual contamination at ℓ=200 in 100×100;
- gal545_A_143, the dust residual contamination at ℓ=200 in 143×143;
- gal545_A_143_217, the dust residual contamination at ℓ=200 in 143×217;
- gal545_A_217, the dust residual contamination at ℓ=200 in 217×217;
- calib_100T, the relative calibration between the 100 and 143 spectra;
- calib_217T, the relative calibration between the 217 and 143 spectra;
- A_planck, the Planck absolute calibration.
We recommend using the following Gaussian priors:
- ksz_norm + 1.6 × A_sz = 9.5±3.0;
- cib_index = -1.3;
- gal545_A_100 = 7±2;
- gal545_A_143 = 9±2;
- gal545_A_143_217 = 21.0±8.5;
- gal545_A_217 = 80±20;
- calib_100T = 0.999±0.001;
- calib_217T = 0.995±0.002;
- A_planck = 1.0000±0.0025.
TT+TE+EE - Plik
This file allows for the computation of the CMB joint TT, TE, and EE likelihood in the range ℓ=30-2508 for TT and ℓ=30-1996 for TE and EE.
Production process
The file contains the 100-GHz, 143-GHz, and 217-GHz binned half-mission T and E cross-spectra.
In temperature, only the 100×100, 143×143, 143×217, and 217×217 spectra are actually used, while
in TE and EE all of them are used. Masks and multipole
ranges for each spectrum are different and described in Planck-2015-A11[5].
Masks are based on CMB-cleaned 353-GHz map for the dust component, on the Planck catalogues for the point source part, and on the CO maps.
The file also contains
templates for the residual foreground contamination of each spectrum. The templates are needed
to allow the computation of the joint CMB and nuisance likelihood. The covariance matrix is
computed using an analytical approximation, and corrected for the effect of point sources through Monte Carlo estimates.
The covariance matrix is computed for a fiducial
cosmology and nuisance model that has been obtained using a first, less optimal estimate of the parameters.
Inputs:
- Planck 100-, 143-, and 217-GHz half-mission T+P maps;
- CMB-cleaned (using the SMICA map) 353-GHz map, CO emission maps, and Planck catalogues for the masks;
- Planck 545-GHz and 353-GHz maps for the dust residual contamination template;
- CIB, tSZ, kSZ, and CIB×SZ templates;
- best-fit CMB+foreground model for the beam-leakage template.
File name and usage
The high-ℓ, plik TTTEEE likelihood is distributed in
plc_2.0/hi_l/plik/plik_dx11dr2_HM_v18_TTTEEE.clik.
This file should not be used with any other TT-only high-ℓ file.
When used with the library, this expects a vector of parameters consisting of the
TT CMB power spectrum from ℓ=0 to 2508 (inclusive), followed the EE and TE spectra (same range) and by a vector of 94 nuisance parameters.
Those are, in g:
- A_cib_217, the CIB contamination at ℓ=3000 in the 217-GHz Planck map;
- cib_index, the effective slope of the CIB spectrum, which should be set to -1.3;
- xi_sz_cib, the SZ×CIB cross-correlation;
- A_sz, the tSZ contamination at 143GHz;
- ps_A_100_100, the point source contribution in 100×100;
- ps_A_143_143, the point source contribution in 143×143;
- ps_A_143_217, the point source contribution in 143×217;
- ps_A_217_217, the point source contribution in 217×217;
- ksz_norm, the kSZ contamination;
- gal545_A_100, the dust residual contamination at ℓ=200 in 100×100TT;
- gal545_A_143, the dust residual contamination at ℓ=200 in 143×143TT;
- gal545_A_143_217, the dust residual contamination at ℓ=200 in 143×217TT;
- gal545_A_217, the dust residual contamination at ℓ=200 in 217×217TT;
- galf_EE_A_100, the dust residual contamination at ℓ=500 in 100×100EE;
- galf_EE_A_100_143, the dust residual contamination at ℓ=500 in 100×143EE;
- galf_EE_A_100_217, the dust residual contamination at ℓ=500 in 100×217EE;
- galf_EE_A_143, the dust residual contamination at ℓ=500 in 143×143EE;
- galf_EE_A_143_217, the dust residual contamination at ℓ=500 in 143×217EE;
- galf_EE_A_217, the dust residual contamination at ℓ=500 in 217×217EE;
- galf_EE_index, the dust EE template slope, which should be set to -2.4;
- galf_TE_A_100, the dust residual contamination at ℓ=500 in 100×100TE;
- galf_TE_A_100_143, the dust residual contamination at ℓ=500 in 100×143TE;
- galf_TE_A_100_217, the dust residual contamination at ℓ=500 in 100×217TE;
- galf_TE_A_143, the dust residual contamination at ℓ=500 in 143x143TE;
- galf_TE_A_143_217, the dust residual contamination at ℓ=500 in 143×217TE;
- galf_TE_A_217, the dust residual contamination at ℓ=500 in 217×217TE;
- galf_TE_index, the dust EE template slope, which should be set to -2.4;
- bleak_epsilon_0_0T_0E, beam-leakage parameter, espilon_0, 100×100 TE;
- bleak_epsilon_1_0T_0E, beam-leakage parameter, espilon_1, 100×100 TE;
- bleak_epsilon_2_0T_0E, beam-leakage parameter, espilon_2, 100×100 TE;
- bleak_epsilon_3_0T_0E, beam-leakage parameter, espilon_3, 100×100 TE;
- bleak_epsilon_4_0T_0E, beam-leakage parameter, espilon_4, 100×100 TE;
- bleak_epsilon_0_0T_1E, beam-leakage parameter, espilon_0, 100×143 TE;
- bleak_epsilon_1_0T_1E, beam-leakage parameter, espilon_1, 100×143 TE;
- bleak_epsilon_2_0T_1E, beam-leakage parameter, espilon_2, 100×143 TE;
- bleak_epsilon_3_0T_1E, beam-leakage parameter, espilon_3, 100×143 TE;
- bleak_epsilon_4_0T_1E, beam-leakage parameter, espilon_4, 100×143 TE;
- bleak_epsilon_0_0T_2E, beam-leakage parameter, espilon_0, 100×217 TE;
- bleak_epsilon_1_0T_2E, beam-leakage parameter, espilon_1, 100×217 TE;
- bleak_epsilon_2_0T_2E, beam-leakage parameter, espilon_2, 100×217 TE;
- bleak_epsilon_3_0T_2E, beam-leakage parameter, espilon_3, 100×217 TE;
- bleak_epsilon_4_0T_2E, beam-leakage parameter, espilon_4, 100×217 TE;
- bleak_epsilon_0_1T_1E, beam-leakage parameter, espilon_0, 143×143 TE;
- bleak_epsilon_1_1T_1E, beam-leakage parameter, espilon_1, 143×143 TE;
- bleak_epsilon_2_1T_1E, beam-leakage parameter, espilon_2, 143×143 TE;
- bleak_epsilon_3_1T_1E, beam-leakage parameter, espilon_3, 143×143 TE;
- bleak_epsilon_4_1T_1E, beam-leakage parameter, espilon_4, 143×143 TE;
- bleak_epsilon_0_1T_2E, beam-leakage parameter, espilon_0, 143×217 TE;
- bleak_epsilon_1_1T_2E, beam-leakage parameter, espilon_1, 143×217 TE;
- bleak_epsilon_2_1T_2E, beam-leakage parameter, espilon_2, 143×217 TE;
- bleak_epsilon_3_1T_2E, beam-leakage parameter, espilon_3, 143×217 TE;
- bleak_epsilon_4_1T_2E, beam-leakage parameter, espilon_4, 143×217 TE;
- bleak_epsilon_0_2T_2E, beam-leakage parameter, espilon_0, 217×217 TE;
- bleak_epsilon_1_2T_2E, beam-leakage parameter, espilon_1, 217×217 TE;
- bleak_epsilon_2_2T_2E, beam-leakage parameter, espilon_2, 217×217 TE;
- bleak_epsilon_3_2T_2E, beam-leakage parameter, espilon_3, 217×217 TE;
- bleak_epsilon_4_2T_2E, beam-leakage parameter, espilon_4, 217×217 TE;
- bleak_epsilon_0_0E_0E, beam-leakage parameter, espilon_0, 100×100 EE;
- bleak_epsilon_1_0E_0E, beam-leakage parameter, espilon_1, 100×100 EE;
- bleak_epsilon_2_0E_0E, beam-leakage parameter, espilon_2, 100×100 EE;
- bleak_epsilon_3_0E_0E, beam-leakage parameter, espilon_3, 100×100 EE;
- bleak_epsilon_4_0E_0E, beam-leakage parameter, espilon_4, 100×100 EE;
- bleak_epsilon_0_0E_1E, beam-leakage parameter, espilon_0, 100×143 EE;
- bleak_epsilon_1_0E_1E, beam-leakage parameter, espilon_1, 100×143 EE;
- bleak_epsilon_2_0E_1E, beam-leakage parameter, espilon_2, 100×143 EE;
- bleak_epsilon_3_0E_1E, beam-leakage parameter, espilon_3, 100×143 EE;
- bleak_epsilon_4_0E_1E, beam-leakage parameter, espilon_4, 100×143 EE;
- bleak_epsilon_0_0E_2E, beam-leakage parameter, espilon_0, 100×217 EE;
- bleak_epsilon_1_0E_2E, beam-leakage parameter, espilon_1, 100×217 EE;
- bleak_epsilon_2_0E_2E, beam-leakage parameter, espilon_2, 100×217 EE;
- bleak_epsilon_3_0E_2E, beam-leakage parameter, espilon_3, 100×217 EE;
- bleak_epsilon_4_0E_2E, beam-leakage parameter, espilon_4, 100×217 EE;
- bleak_epsilon_0_1E_1E, beam-leakage parameter, espilon_0, 143×143 EE;
- bleak_epsilon_1_1E_1E, beam-leakage parameter, espilon_1, 143×143 EE;
- bleak_epsilon_2_1E_1E, beam-leakage parameter, espilon_2, 143×143 EE;
- bleak_epsilon_3_1E_1E, beam-leakage parameter, espilon_3, 143×143 EE;
- bleak_epsilon_4_1E_1E, beam-leakage parameter, espilon_4, 143×143 EE;
- bleak_epsilon_0_1E_2E, beam-leakage parameter, espilon_0, 143×217 EE;
- bleak_epsilon_1_1E_2E, beam-leakage parameter, espilon_1, 143×217 EE;
- bleak_epsilon_2_1E_2E, beam-leakage parameter, espilon_2, 143×217 EE;
- bleak_epsilon_3_1E_2E, beam-leakage parameter, espilon_3, 143×217 EE;
- bleak_epsilon_4_1E_2E, beam-leakage parameter, espilon_4, 143×217 EE;
- bleak_epsilon_0_2E_2E, beam-leakage parameter, espilon_0, 217×217 EE;
- bleak_epsilon_1_2E_2E, beam-leakage parameter, espilon_1, 217×217 EE;
- bleak_epsilon_2_2E_2E, beam-leakage parameter, espilon_2, 217×217 EE;
- bleak_epsilon_3_2E_2E, beam-leakage parameter, espilon_3, 217×217 EE;
- bleak_epsilon_4_2E_2E, beam-leakage parameter, espilon_4, 217×217 EE;
- calib_100T, the relative calibration between 100 and 143 TT spectra;
- calib_217T, the relative calibration between 217 and 143 TT spectra;
- calib_100P, the calibration of the 100 EE spectra, which should be set to 1;
- calib_143P, the calibration of the 143 EE spectra, which should be set to 1;
- calib_217P, the calibration of the 217 EE spectra, which should be set to 1;
- A_pol, the calibration of the polarization relative to the temperature, which should be set to 1;
- A_planck, the Planck absolute calibration.
We recommend using the following Gaussian priors:
- ksz_norm + 1.6 × A_sz = 9.5±3.0;
- cib_index = -1.3;
- gal545_A_100 = 7±2;
- gal545_A_143 = 9±2;
- gal545_A_143_217 = 21.0±8.5;
- gal545_A_217 = 80±20;
- galf_EE_A_100 = 0.060±0.012;
- galf_EE_A_100_143 = 0.050±0.015;
- galf_EE_A_100_217 = 0.110±0.033;
- galf_EE_A_143 = 0.10±0.02;
- galf_EE_A_143_217 = 0.240±0.048;
- galf_EE_A_217 = 0.72±0.14;
- galf_EE_index = -2.4;
- galf_TE_A_100 = 0.140±0.042;
- galf_TE_A_100_143 = 0.120±0.036;
- galf_TE_A_100_217 = 0.30±0.09;
- galf_TE_A_143 = 0.240±0.072;
- galf_TE_A_143_217 = 0.60±0.018;
- galf_TE_A_217 = 1.80±0.54;
- galf_TE_index = -2.4;
- bleak_epsilon_0_0T_0E = 0;
- bleak_epsilon_1_0T_0E = 0;
- bleak_epsilon_2_0T_0E = 0;
- bleak_epsilon_3_0T_0E = 0;
- bleak_epsilon_4_0T_0E = 0;
- bleak_epsilon_0_0T_1E = 0;
- bleak_epsilon_1_0T_1E = 0;
- bleak_epsilon_2_0T_1E = 0;
- bleak_epsilon_3_0T_1E = 0;
- bleak_epsilon_4_0T_1E = 0;
- bleak_epsilon_0_0T_2E = 0;
- bleak_epsilon_1_0T_2E = 0;
- bleak_epsilon_2_0T_2E = 0;
- bleak_epsilon_3_0T_2E = 0;
- bleak_epsilon_4_0T_2E = 0;
- bleak_epsilon_0_1T_1E = 0;
- bleak_epsilon_1_1T_1E = 0;
- bleak_epsilon_2_1T_1E = 0;
- bleak_epsilon_3_1T_1E = 0;
- bleak_epsilon_4_1T_1E = 0;
- bleak_epsilon_0_1T_2E = 0;
- bleak_epsilon_1_1T_2E = 0;
- bleak_epsilon_2_1T_2E = 0;
- bleak_epsilon_3_1T_2E = 0;
- bleak_epsilon_4_1T_2E = 0;
- bleak_epsilon_0_2T_2E = 0;
- bleak_epsilon_1_2T_2E = 0;
- bleak_epsilon_2_2T_2E = 0;
- bleak_epsilon_3_2T_2E = 0;
- bleak_epsilon_4_2T_2E = 0;
- bleak_epsilon_0_0E_0E = 0;
- bleak_epsilon_1_0E_0E = 0;
- bleak_epsilon_2_0E_0E = 0;
- bleak_epsilon_3_0E_0E = 0;
- bleak_epsilon_4_0E_0E = 0;
- bleak_epsilon_0_0E_1E = 0;
- bleak_epsilon_1_0E_1E = 0;
- bleak_epsilon_2_0E_1E = 0;
- bleak_epsilon_3_0E_1E = 0;
- bleak_epsilon_4_0E_1E = 0;
- bleak_epsilon_0_0E_2E = 0;
- bleak_epsilon_1_0E_2E = 0;
- bleak_epsilon_2_0E_2E = 0;
- bleak_epsilon_3_0E_2E = 0;
- bleak_epsilon_4_0E_2E = 0;
- bleak_epsilon_0_1E_1E = 0;
- bleak_epsilon_1_1E_1E = 0;
- bleak_epsilon_2_1E_1E = 0;
- bleak_epsilon_3_1E_1E = 0;
- bleak_epsilon_4_1E_1E = 0;
- bleak_epsilon_0_1E_2E = 0;
- bleak_epsilon_1_1E_2E = 0;
- bleak_epsilon_2_1E_2E = 0;
- bleak_epsilon_3_1E_2E = 0;
- bleak_epsilon_4_1E_2E = 0;
- bleak_epsilon_0_2E_2E = 0;
- bleak_epsilon_1_2E_2E = 0;
- bleak_epsilon_2_2E_2E = 0;
- bleak_epsilon_3_2E_2E = 0;
- bleak_epsilon_4_2E_2E = 0;
- calib_100T = 0.999±0.001;
- calib_217T = 0.995±0.002;
- calib_100P = 1;
- calib_143P = 1;
- calib_217P = 1;
- A_pol = 1;
- A_planck = 1.0000±0.0025.
TT only - Plik lite
This file allows for the computation of the nuisance-marginalized CMB TT likelihood in the range ℓ=30-2508. It should not be used with the regular high-ℓ TT or TTTEEE files.
Production process
The Plik likelihood files described above have been explored using a Bayesian algorithm described in Planck-2015-A11[5]. The joint posterior of the CMB TT spectrum, marginalized over the nuisance parameters, has been extracted from this analysis to build a high-ℓ likelihood approximation for the
CMB spectrum only. The nuisance parameters have been marginalized in the priors described above.
Inputs:
- Plik plik_dx11dr2_HM_v18_TT likelihood;
- dust residual, CIB, tSZ, kSZ, and CIB×SZ templates.
File name and usage
The high-ℓ, Plik TT, nuisance-marginalized likelihood is distributed in
plc_2.0/hi_l/plik_lite/plik_lite_v18_TT.clik.
When used with the library, this expects a vector of parameters consisting of the
TT CMB power spectrum from ℓ=0 to 2508 (inclusive), followed by the Planck absolute calibration nuisance parameter.
TT EE TE - Plik lite
This file allows for the computation of the nuisance marginalized CMB joint TT, TE, EE likelihood in the range ℓ=30-2508 for temperature and ℓ=30-1996 for TE and EE. It should not be used with the regular high-ℓ TT or TTTEEE files.
Production process
The Plik likelihood file described above have been explored using a Bayesian algorithm described in Planck-2015-A11[5]. The joint posterior of the CMB TT, TE, and EE spectra, marginalized over the nuisance parameters has been extracted from this analysis to build a high-ℓ likelihood approximation for the
CMB spectrum only. The nuisance parameters have been marginalized in the priors described above.
Inputs:
- Plik plik_dx11dr2_HM_v18_TTTEEE likelihood;
- dust residual, CIB, tSZ, kSZ, and CIB×SZ templates.
File name and usage
The high-ℓ, Plik TTTEEE, nuisance-marginalized likelihood is distributed in
plc_2.0/hi_l/plik_lite/plik_lite_v18_TTTEEE.clik.
When used with the library, this expects a vector of parameters consisting of the
TT CMB power spectrum from ℓ=0 to 2508 (inclusive), followed by the EE, and TE spectra (same range) and by the Planck absolute calibration nuisance parameter.
Lensing likelihoods
T only
This file allows for the computation of the baseline lensing likelihood, using only the SMICA T
map-based lensing reconstruction. Only the lensing multipole range ℓ=40-400
is used. The covariance matrix for the likelihood is based on Monte Carlos. The likelihood includes
the computation of a model-dependent correction to the normalization and
the "N1 bias." To speed up those computations, both are performed using a linear approximation.
Production process
The SMICA T maps are filtered and correlated to reconstruct an optimal
lensing reconstruction map. Biases are corrected using Monte Carlo simulations
for the dominant "mean field" and "N0" contribution, while the "N1" bias is computed using the CMB-based best-fit model. The power spectrum of this map is measured out of a large mask, and binned.
The covariance matrix of this binned spectrum is evaluated using numerical simulations.
The model-dependent corrections to the normalization and N1 biases are linearized and precomputed.
Inputs:
- SMICA T CMB map;
- 60% Galactic mask;
- best-fit Planck CMB model.
File name and usage
The T-only lensing likelihood is distributed in
plc_2.0/hi_l/lensing/smica_g30_ftl_full_pttptt.clik_lensing.
When used with the library, this expects a vector of parameters consisting of the
φφ lensing spectrum for ℓ=0 to 2048 (inclusive), followed by the
TT CMB power spectrum for ℓ=0 to 2048 (inclusive) and by the Planck absolute calibration nuisance parameter.
The TT spectrum is needed to compute the normalization and N1 corrections.
T+P
This file allows for the computation of the baseline lensing likelihood, using both the
T and P SMICA map-based lensing reconstruction. Only the lensing multipole rangeℓ=40-400
is used. The covariance matrix for the likelihood is based on Monte Carlos. The likelihood includes
the computation of model dependent correction to the normalization and
the N1 bias. To speed up those computations, both are performed using a linear approximation.
Production process
The SMICA T and P maps are filtered and correlated to reconstruct an optimal
lensing reconstruction map. Biases are corrected using Monte Carlo simulations
for the dominant mean field and N0 contribution, while the N1 bias is computed using the CMB-based best-fit model. The power spectrum of this map is measured outside a large mask, and binned.
The covariance matrix of this binned spectrum is evaluated using numerical simulations.
The model-dependent corrections to the normalization and N1 biases are linearized and precomputed.
Inputs:
- SMICA T and E CMB maps;
- 60% Galactic mask;
- best-fit Planck CMB model.
File name and usage
The T+P-only lensing likelihood is distributed in
plc_2.0/hi_l/lensing/smica_g30_ftl_full_pp.clik_lensing.
When used with the library, this expects a vector of parameters consisting of the
φφ lensing spectrum for ℓ=0 to 2048 (inclusive), followed by the
TT CMB power spectrum for ℓ=0 to 2048 (inclusive), the EE and TE power spectra (same range) and by the Planck absolute calibration nuisance parameter.
The TT, EE, and TE spectra are needed to compute the normalization and N1 corrections.
Data sets - Extended data
Four other data files are available.
Those extend the baseline delivery by adding:
- TE, EE and other joint high-ℓ Plik likelihoods, COM_Likelihood_Data-extra-plik-HM-ext_R2.00.tar.gz;
- TT and TTTEEE unbinned high-ℓ Plik likelihood, COM_Likelihood_Data-extra-plik-unbinned_R2.00.tar.gz;
- TT, TE, EE, and TTTEEE Plik likelihood using the detset cross-spectra instead of the half-mission one, and including empirical correlated noise correction for the TT spectra, COM_Likelihood_Data-extra-plik-DS_R2.00.tar.gz;
- extended ℓ range lensing likelihood, COM_Likelihood_Data-extra-lensing-ext_R2.00.tar.gz.
Note that although these products are discussed in the Planck papers, they are not used for the baseline results.
Each file contains a readme.md description of the content and the use of the different likelihood files.
Likelihood Masks
General description
We provide the masks for Temperature and Polarisation used to exclude the regions of strongest foreground emission in the CMB maps when computing the empirical spectra that we use to form the high-ℓ likelihood. The masks are provided for each frequency between 100 and 217 GHz, masking the appropriate part of the Galactic Plane and, for temperature only, the relevant population of point sources. Note that to compute the empirical power spectrum of the maps, one should also take into account missing pixels in a particular map. This is not included in the masks we distribute.
Production Process
Complete production process for those masks is described in Planck-2015-A11[5].
The temperature masks are the combination of a Galactic mask, a point source mask and (for 100Ghz and 217GHz) a CO mask. Extended objects, planets, etc are included in the point source mask.
The polarization masks are simply the Galactic masks.
The Galactic masks are obtained by thresholding a CMB corrected and 10^o smoothed 353GHz map. The threshold is tuned so as to retain a given fraction of the sky, between 50% and 80%. Each mask is apodized by a 4^o.71 FWHM gaussian window function using the distance map. Special care is taken to smooth this distance map, in order to avoid strong caustics. The apodization down-weights an effective 10% of the sky. Following Planck-2015-A11[5], the Galactic masks are named by the effective unmasked sky area G70, G60, G50 and G41.
The point source masks are different for each frequency. They are based on the 2015 Planck catalog and cut out all the sources detected at S/N = 5 or higher in each channel. Each source is masked with a circular aperture of size 3xFWHM of that channel (i.e. 3x9.′66 at 100GHz, 3x7.′22 at 143GHz, and 3x4.′90 at 217GHz). Note that we include in the point source masks all sources above our threshold, including possible galactic ones. The mask is further apodized with a gaussian window function with FWHM=30'.
The CO masks is used only at 100GHz and 217GHz, since there is no (strong) CO line in the 147 GHz channel. They are based on the Type 3 CO map from the Planck2013 delivery. The CO map is smoothed to 120' and a threshold is applied to mask all regions above 1 K_{RJ} km s^{−1}. The mask is further apodized to 30'.
Mask combinations are performed by multiplying a galactic, a point source, and possibly a CO mask together.
The Temperature masks are named in Planck-2015-A11[5] using the capital letter T and the effective sky fraction that is left unmasked. They are produced using the following
- 100Ghz: T66 = G70+Point source mask 100Ghz+CO mask
- 143Ghz: T57 = G60+Point source mask 143Ghz
- 217Ghz: T47 = G50+Point source mask 217Ghz+CO mask
The Polarization masks are named in Planck-2015-A11[5] using the capital letter P and the effective sky fraction that is left unmasked. They are produced using the following
- 100Ghz: P70 = G70
- 143Ghz: P50 = G50
- 217Ghz: P41 = G41
Inputs
- Galactic masks: The SMICA CMB temperature map, the 353GHz temperature map.
- Point source masks: The Planck 2015 catalog, the FWHM of each of the frequencies.
- CO mask: the Type 3 CO map from the Planck 2013 delivery.
File names and meta-data
The masks are distributed in a single tar file COM_Likelihood_Masks_R2.00.tar.gz.
The files extract to 6 files
- temperature_100.fits: an nside=2048 healpix map of double precision, containing the Temperature mask used at 100Ghz, i.e. T66
- temperature_143.fits: an nside=2048 healpix map of double precision, containing the Temperature mask used at 143Ghz, i.e. T57
- temperature_217.fits: an nside=2048 healpix map of double precision, containing the Temperature mask used at 217Ghz, i.e. T47
- polarization_100.fits: an nside=2048 healpix map of double precision, containing the Polarization mask used at 100Ghz, i.e. P70
- polarization_143.fits: an nside=2048 healpix map of double precision, containing the Polarization mask used at 143Ghz, i.e. P50
- polarization_217.fits: an nside=2048 healpix map of double precision, containing the Polarization mask used at 217Ghz, i.e. P41


