Difference between revisions of "Appendix of HFI DPC paper"
| Line 11: | Line 11: | ||
{| border="1" cellpadding="3" cellspacing="0" align="center" style="text-align:left" width=800px | {| border="1" cellpadding="3" cellspacing="0" align="center" style="text-align:left" width=800px | ||
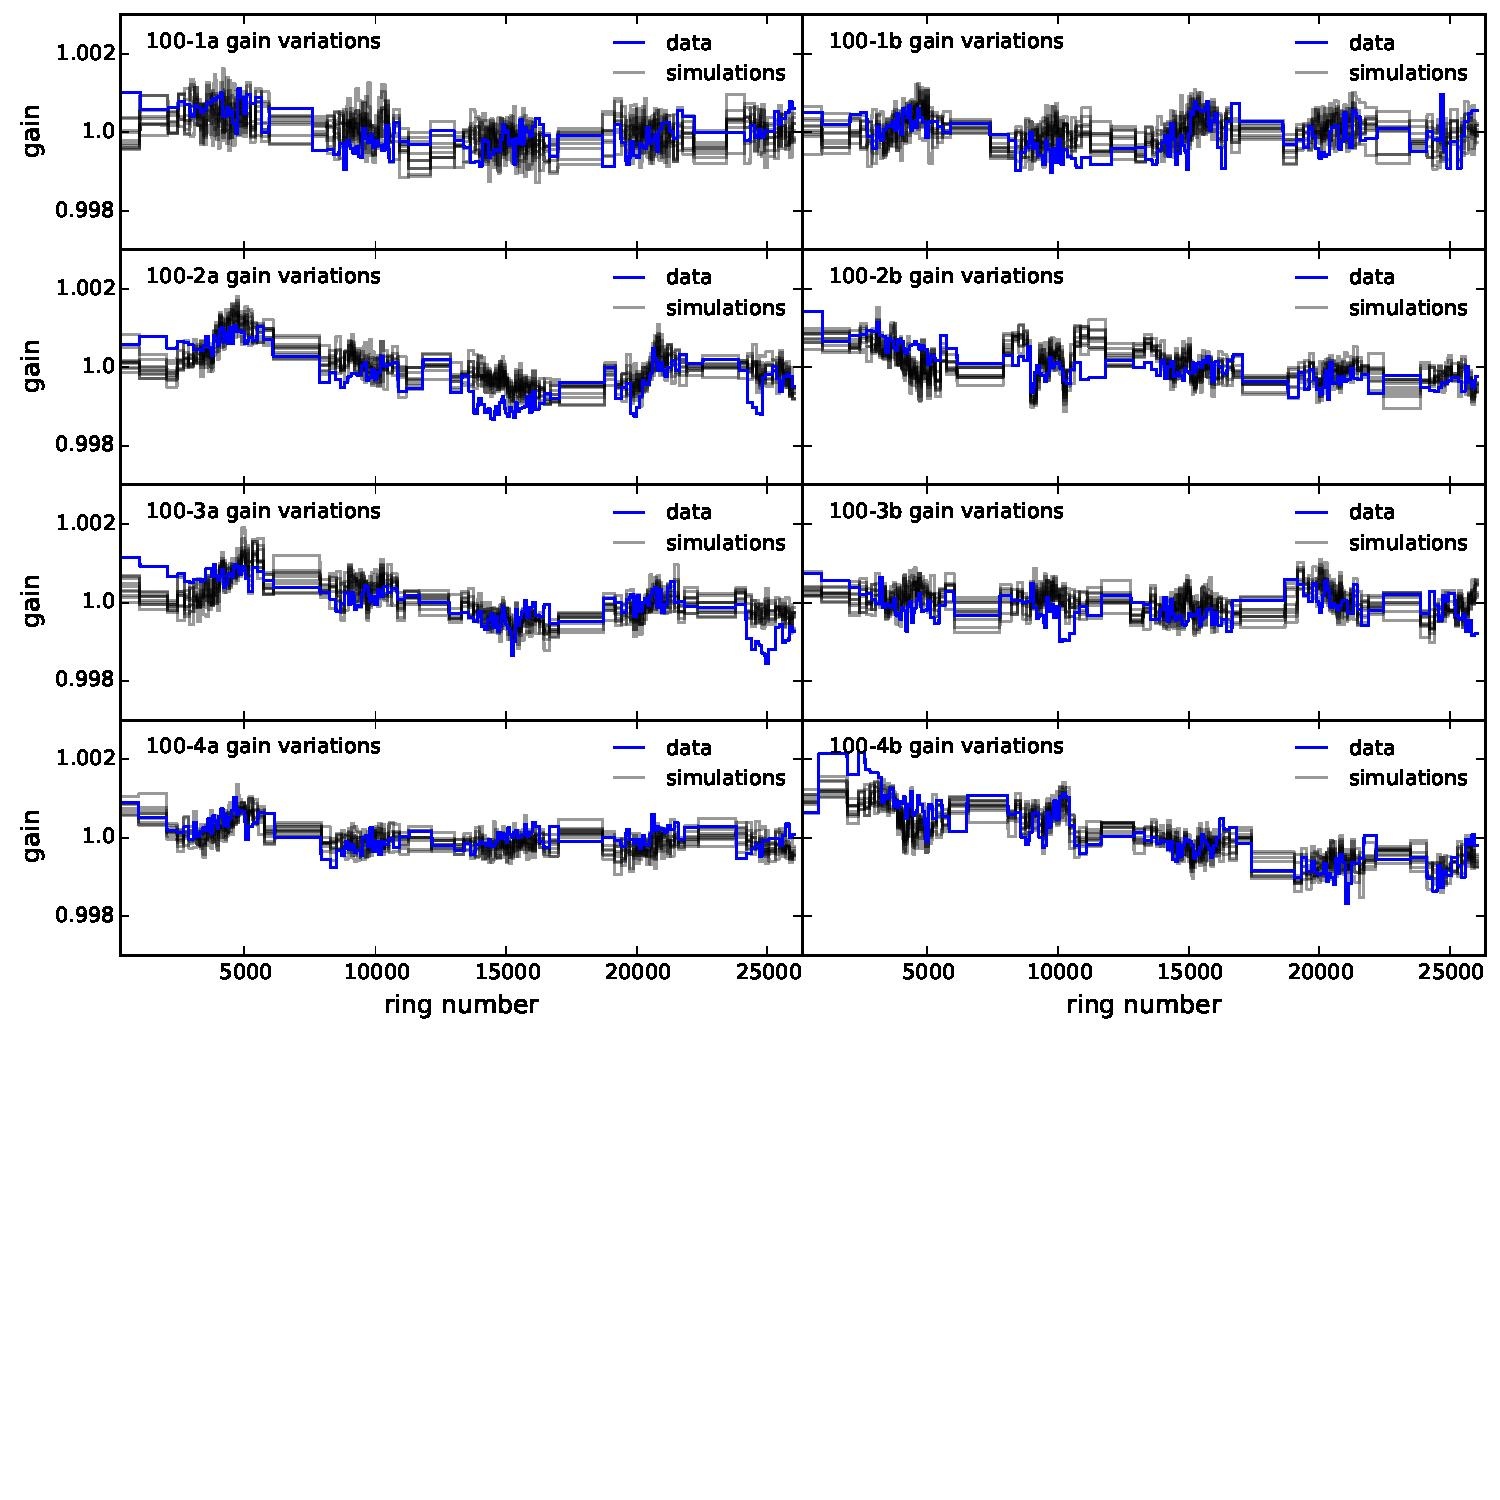
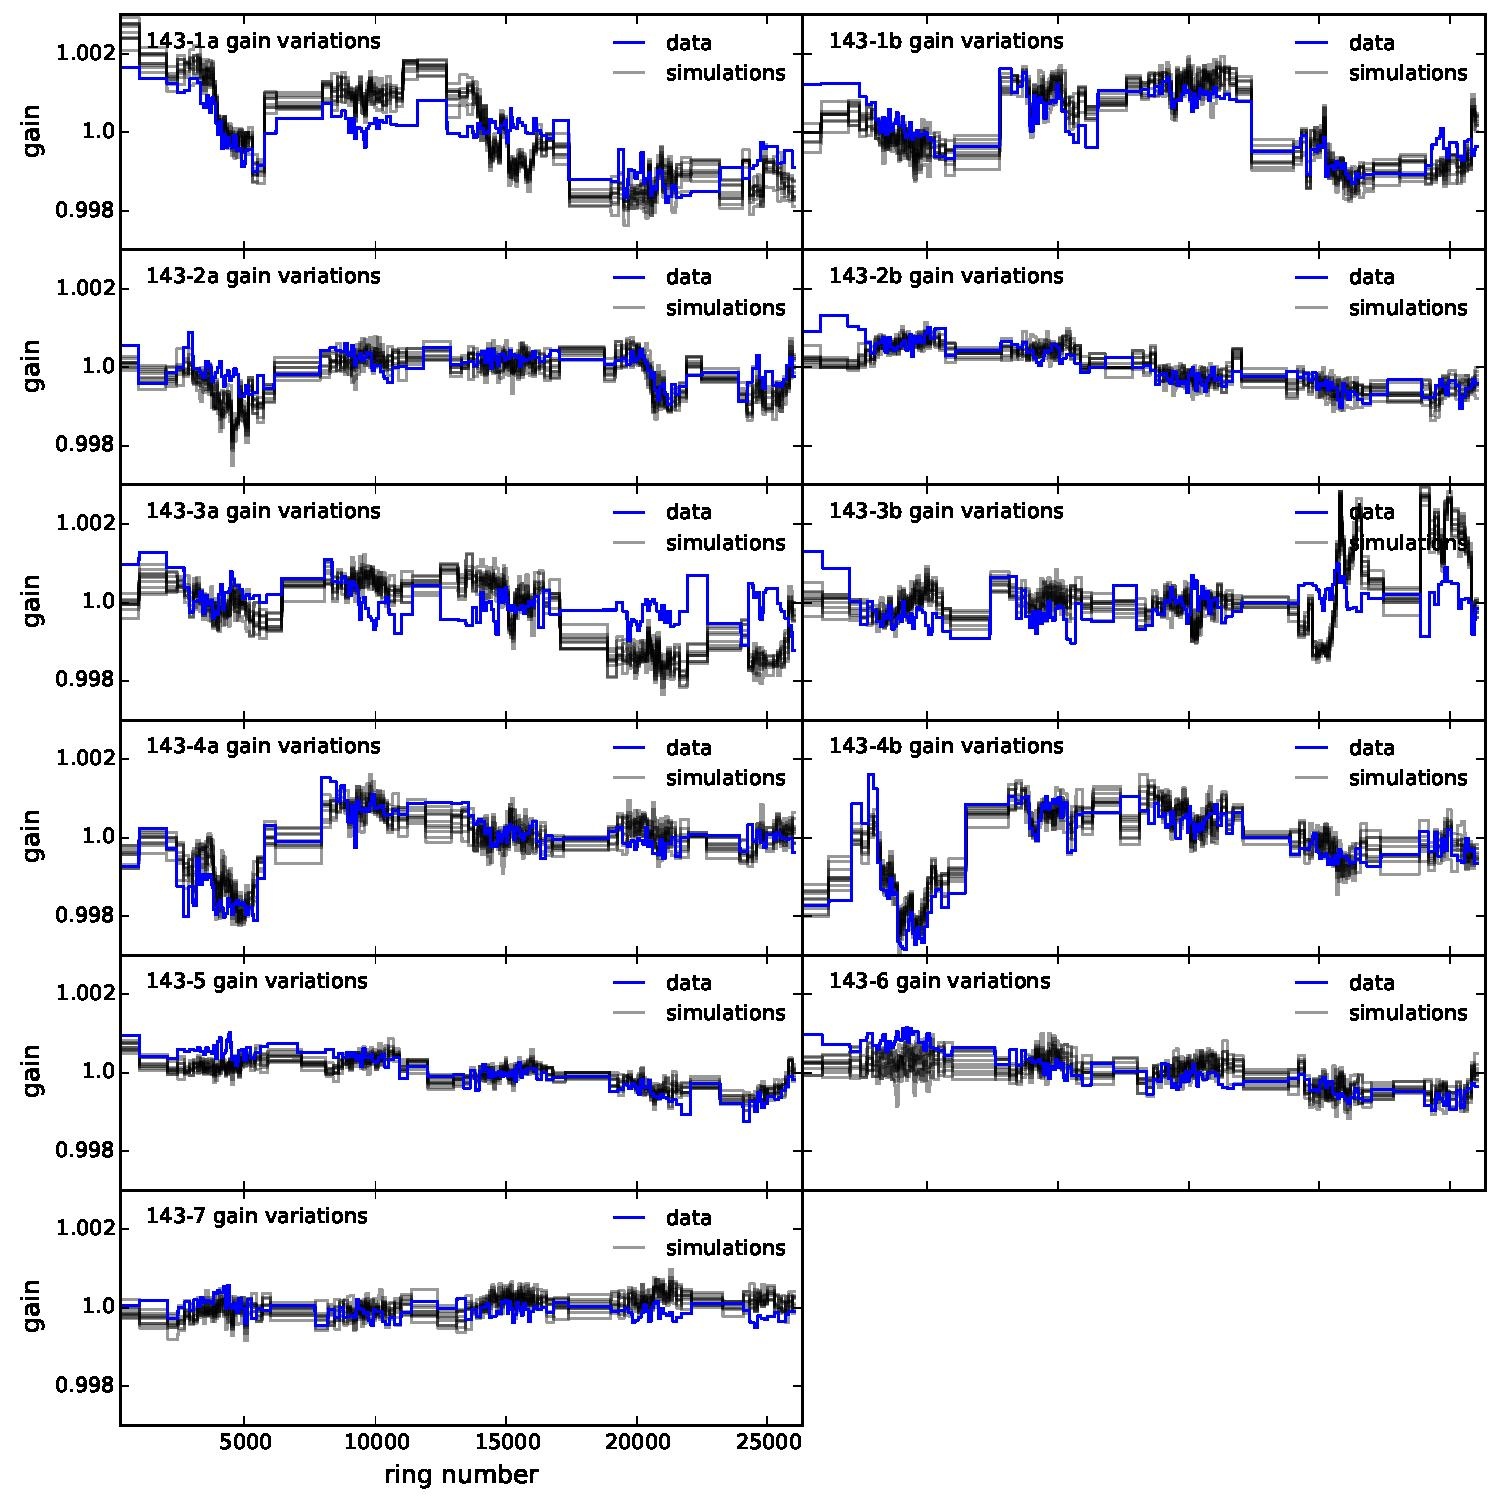
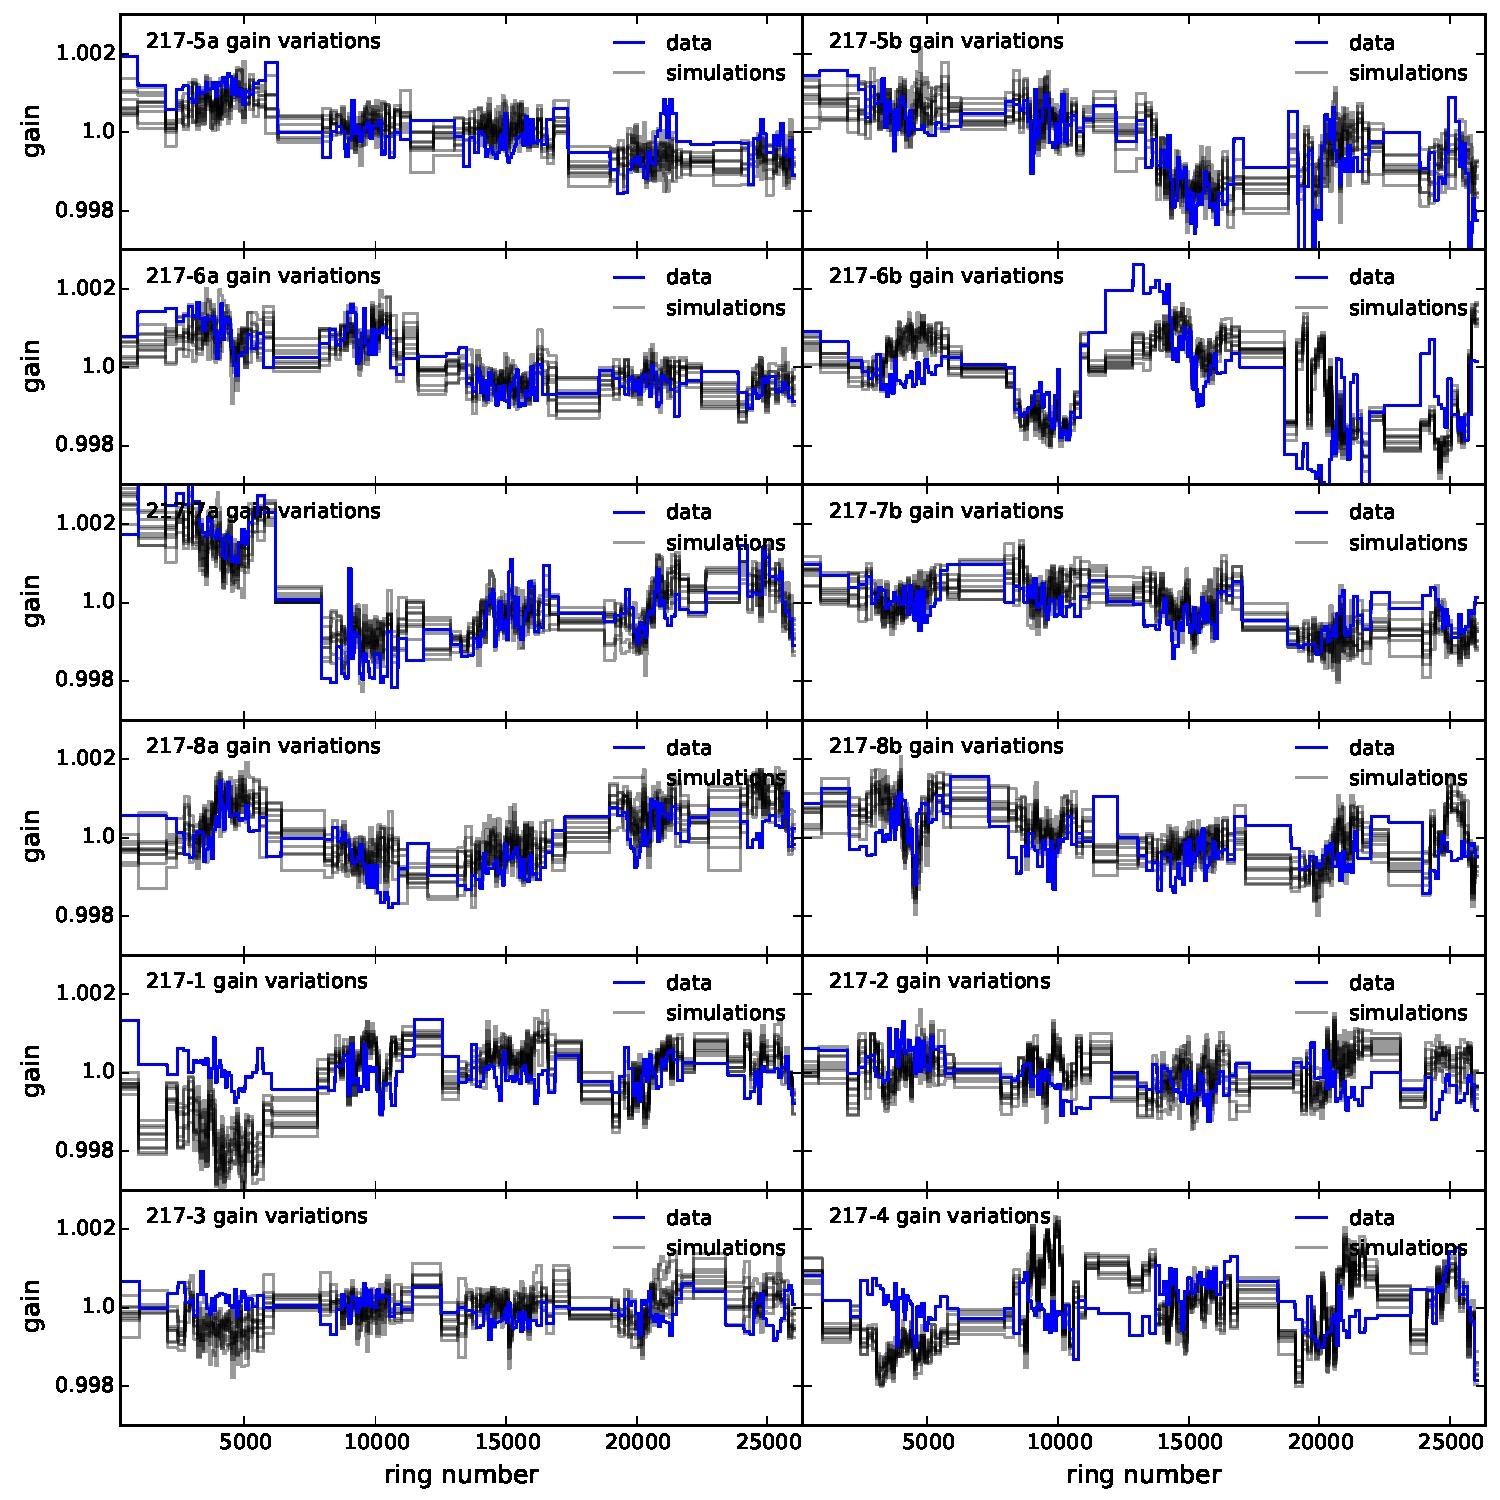
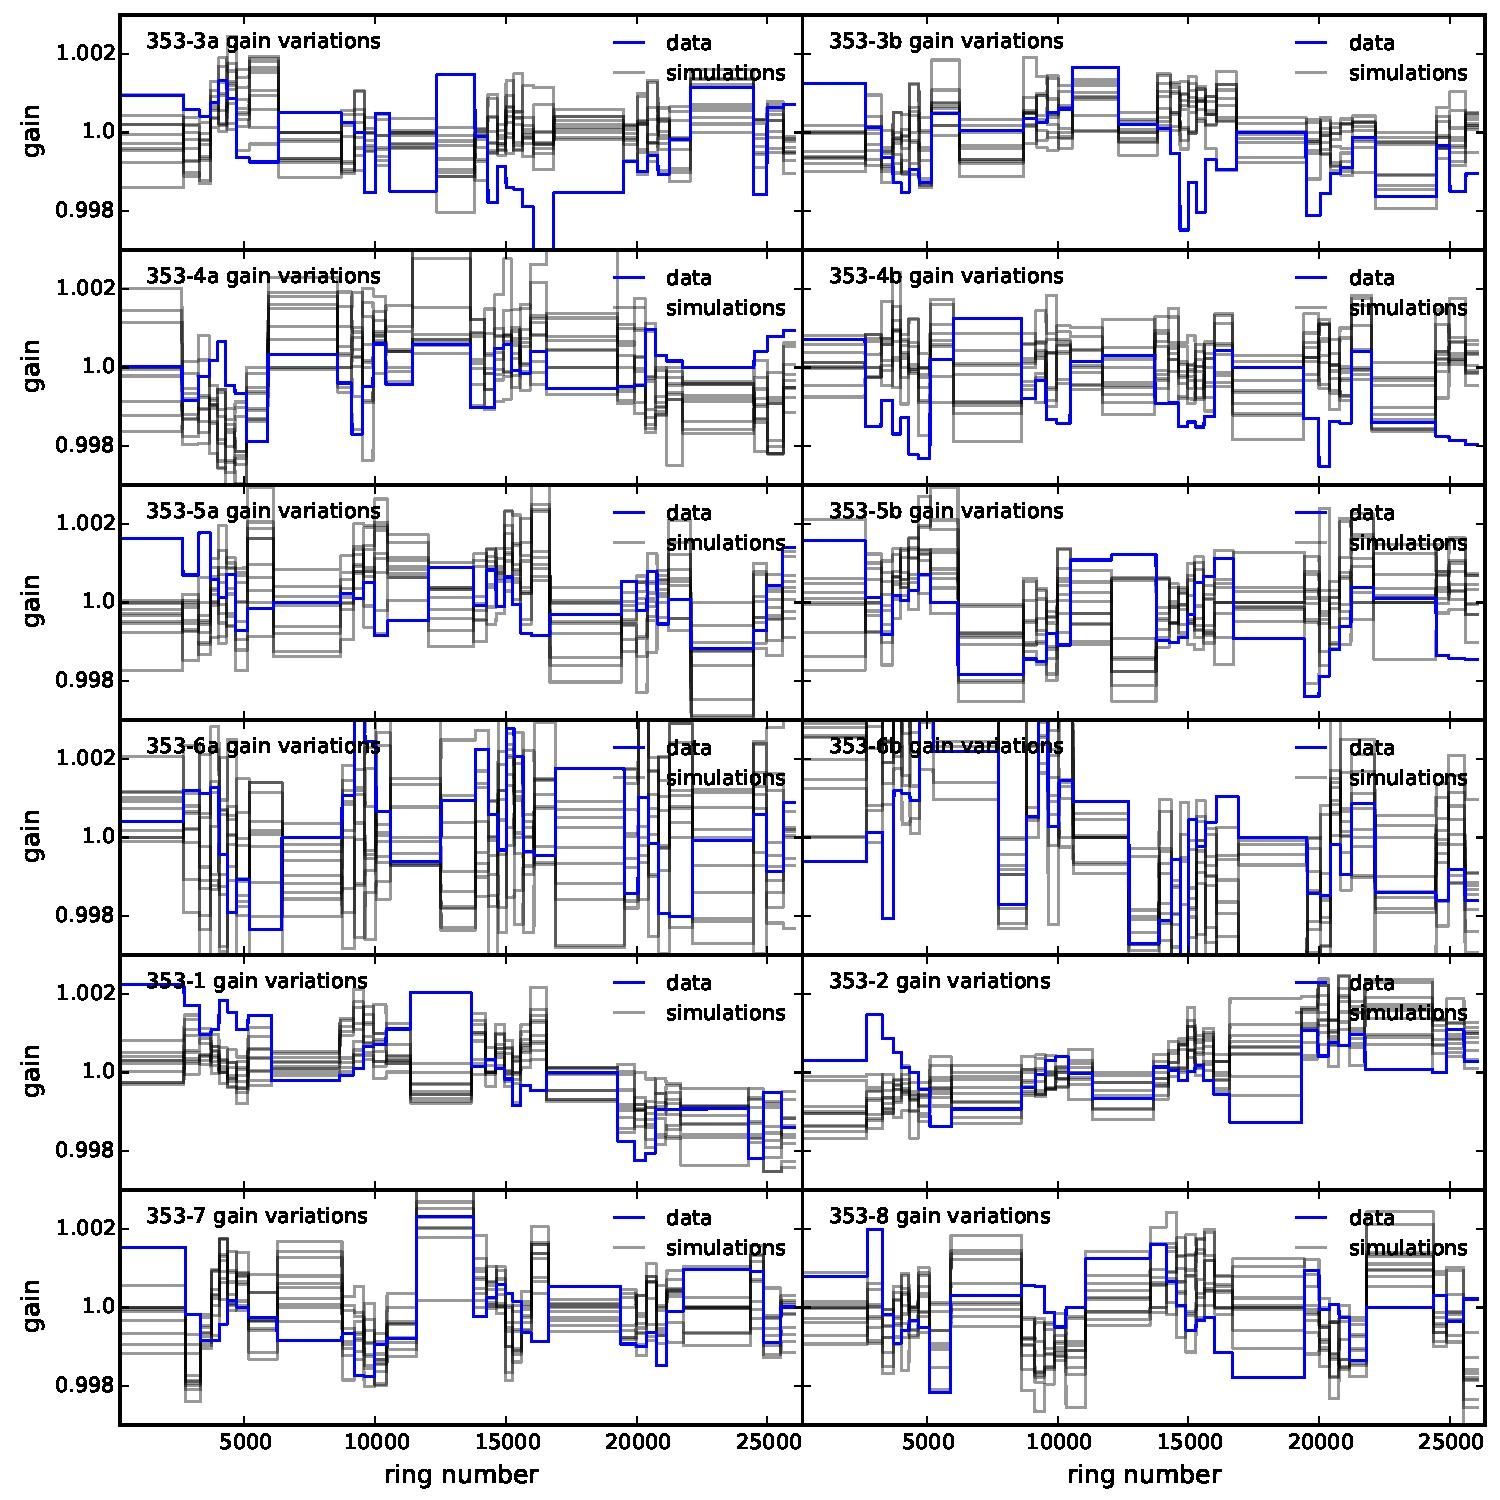
| − | |+ '''ADCNL induced gain time variation as a function of ring numbers. Blue line shows the solved gain variation for the data and grey ones show 10 realizations drawn within the uncertainties of the ADC model. ''' | + | |+ '''[Complementary of Fig. 38:] ADCNL induced gain time variation as a function of ring numbers. Blue line shows the solved gain variation for the data and grey ones show 10 realizations drawn within the uncertainties of the ADC model. ''' |
|- bgcolor="ffdead" | |- bgcolor="ffdead" | ||
! 100 GHz bolometers || 143 GHz bolometers || 217 GHz bolometers || 353 GHz bolometers | ! 100 GHz bolometers || 143 GHz bolometers || 217 GHz bolometers || 353 GHz bolometers | ||
Revision as of 09:39, 9 May 2017
This page is intented to gather figures that are not inserted in the 2017 DPC paper for readability reasons. The page is written and maintained by Laurent, thanks not to modify its content.
Data Processing Center
analog to digital converter
