Difference between revisions of "FSLFits"
| Line 1: | Line 1: | ||
| − | Individual horn/survey fit values. | + | Individual horn/survey fit values. For each of the graphics below, red symbols correspond to the first year of data, and blue correspond to the second year of data. Squares are for the first survey in the year (i.e., survey 1 for year 1 or survey 3 for year 2) and circles are for the second survey in the year. The grey symbols are the averages for each horn, and the grey swaths correspond for the averages over the frequency. |
{| | {| | ||
Latest revision as of 22:28, 7 March 2013
Individual horn/survey fit values. For each of the graphics below, red symbols correspond to the first year of data, and blue correspond to the second year of data. Squares are for the first survey in the year (i.e., survey 1 for year 1 or survey 3 for year 2) and circles are for the second survey in the year. The grey symbols are the averages for each horn, and the grey swaths correspond for the averages over the frequency.
| 857 GHz | 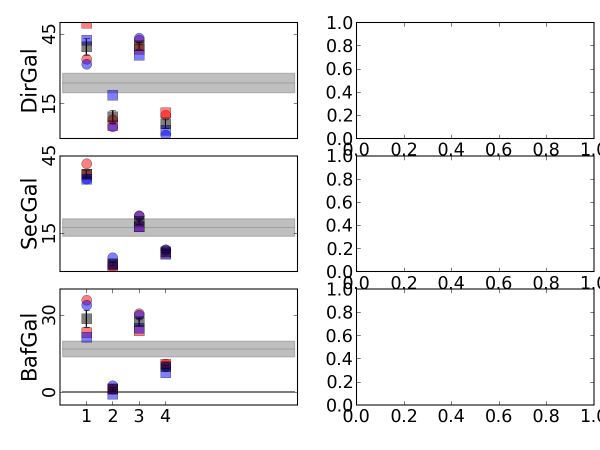
|
| 545 GHz | 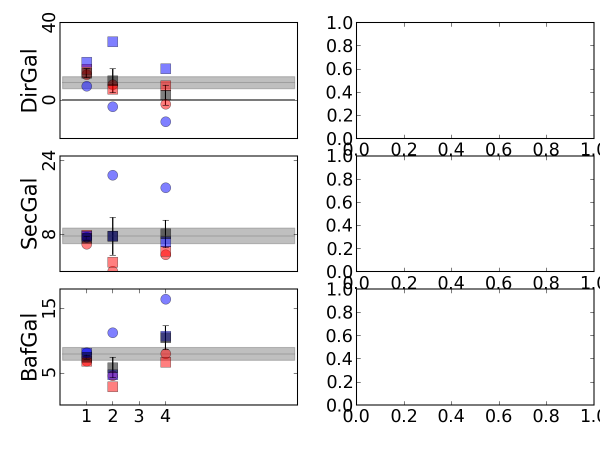
|
| 353 GHz | 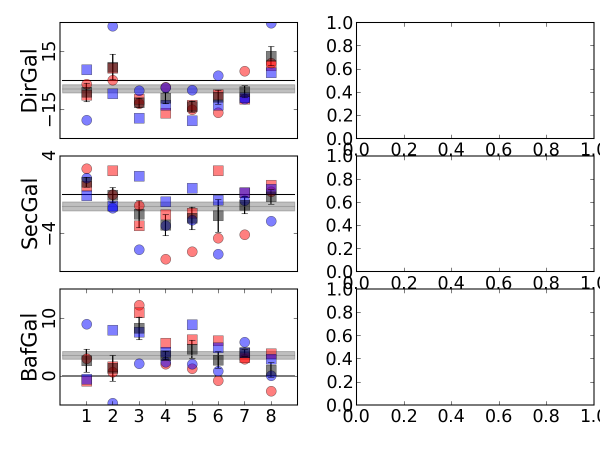
|
| 217 GHz | 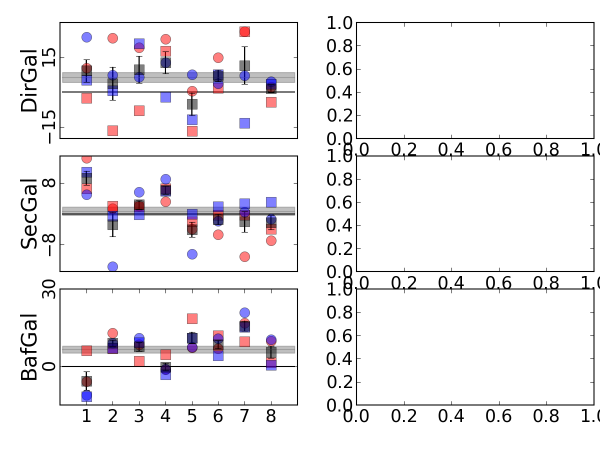
|
| 143 GHz | 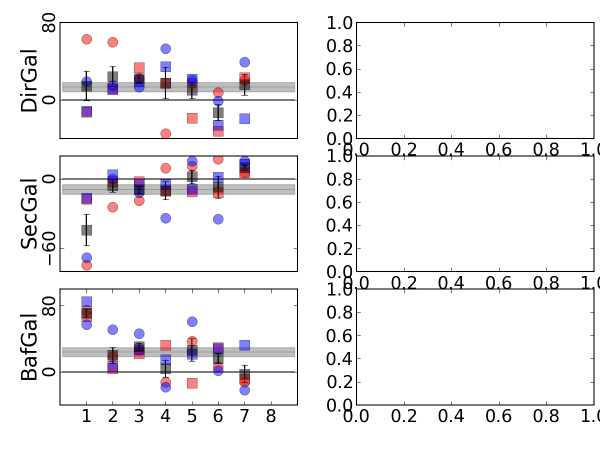
|
| 100 GHz | 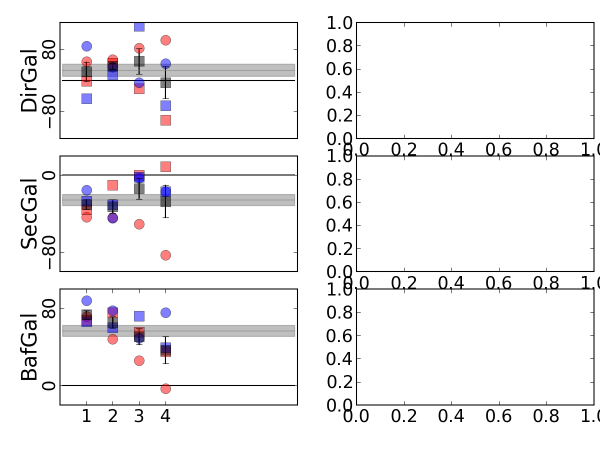
|