Difference between revisions of "HFI performance summary"
m |
m |
||
| Line 6: | Line 6: | ||
[[File:Screen Shot 2018-06-21 at 20.17.58.png|center]] | [[File:Screen Shot 2018-06-21 at 20.17.58.png|center]] | ||
| − | The cleaning process has evolved overtime and the measured noise characteristics have correspondingly changed. The diagram below (from {{PlanckPapers| | + | The cleaning process has evolved overtime and the measured noise characteristics have correspondingly changed. The diagram below (from {{PlanckPapers|planck2011-1-6}} illustrates the main steps of the cleaning process. |
[[File:Screen Shot 2018-06-22 at 09.12.06.png]] | [[File:Screen Shot 2018-06-22 at 09.12.06.png]] | ||
| + | The two tables below give two snapshots of this evolution. The first table (from {{PlanckPapers|planck2013-p06}}) applies to the 2013 release products, and the second table (from {{PlanckPapers|planck2014-a07}}) applies to the 2015 and 2018 release products. | ||
| + | [[File:Screen Shot 2018-06-22 at 09.18.05.png]] | ||
| + | [[File:Screen Shot 2018-06-22 at 09.22.34.png]] | ||
Revision as of 07:30, 22 June 2018
The HFI operated flawlessly for 30 months, the maximum autonomy expected for the helium of the dilution cooler. The telescope pointing was achieved with an accuracy better than expected and reconstructed to a few seconds of arc. Fifty of the 52 bolometers collected data in very stable conditions during the whole mission, and practically all of the data were correctly recorded.
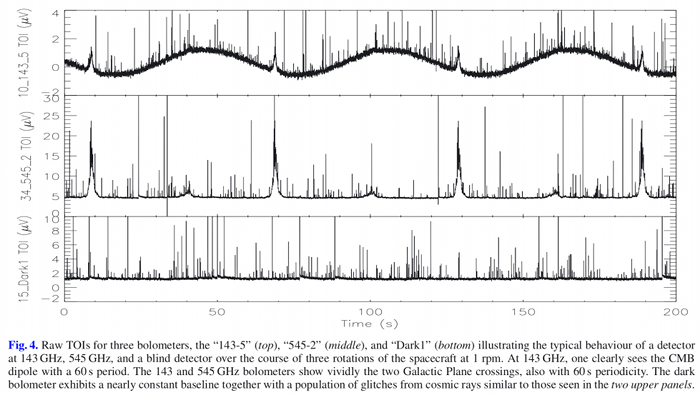
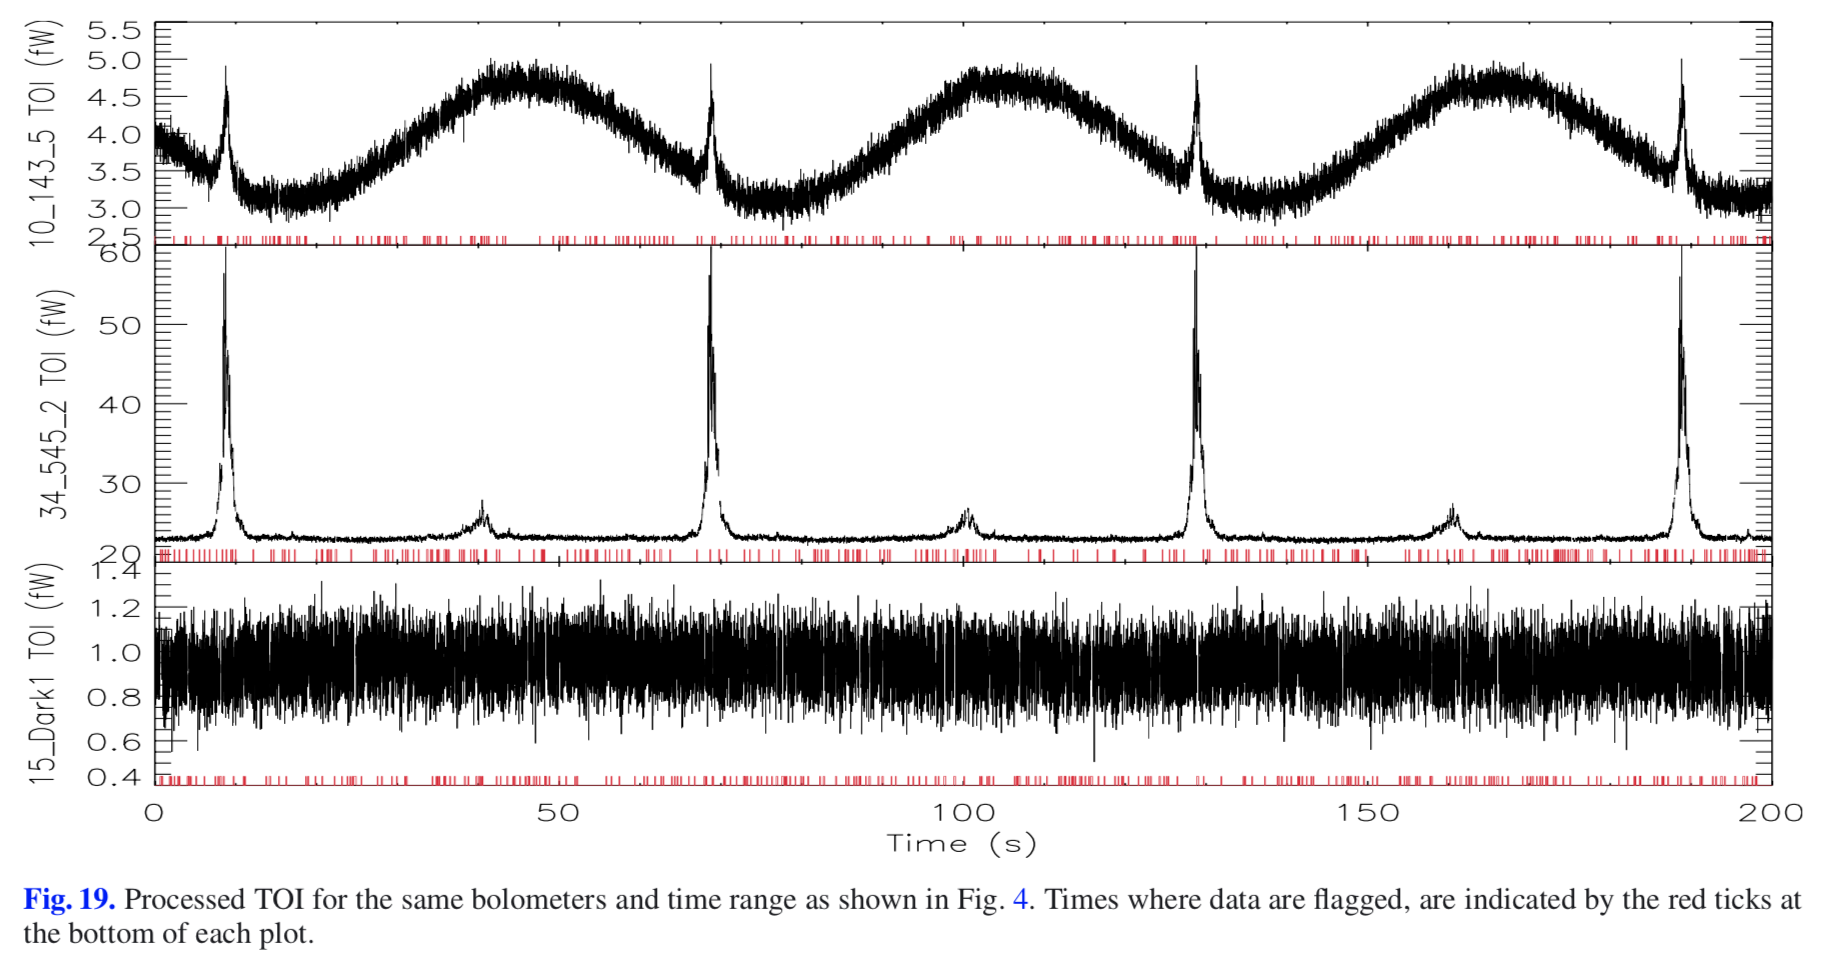
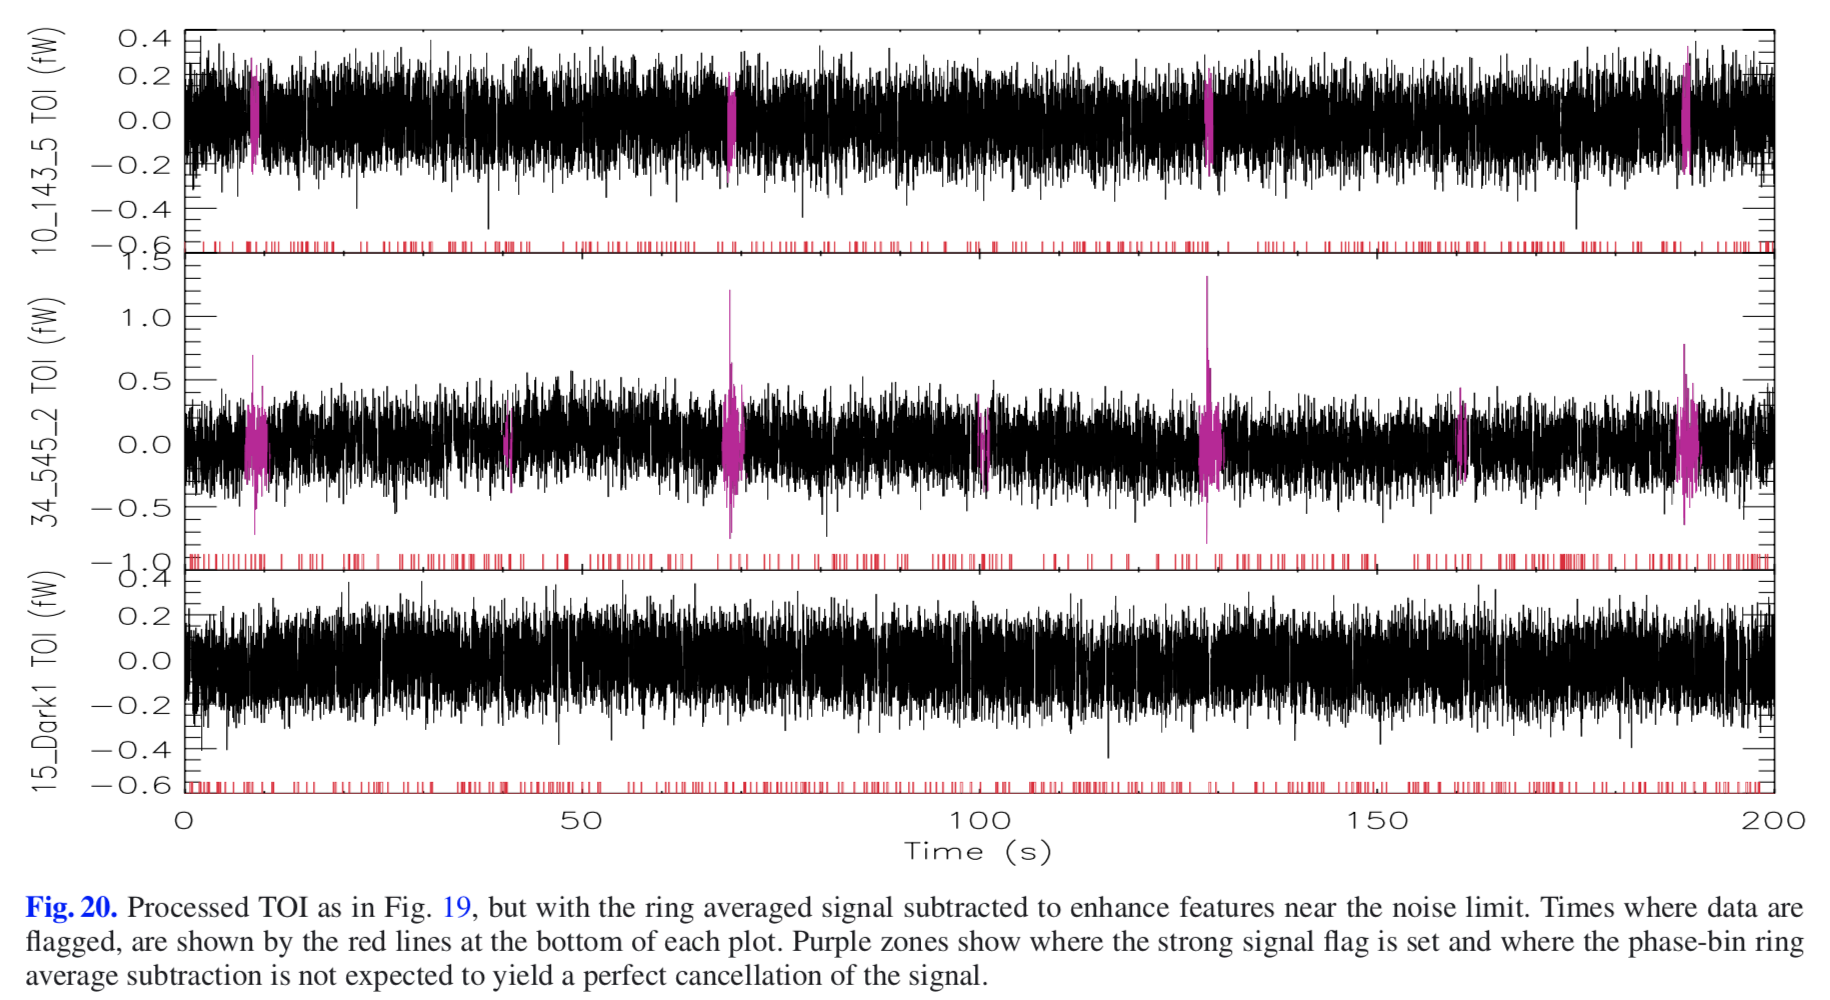
The noise performance of HFI bolometers is measured on timelines which have been cleaned of features such as glitches, and from which the signal has been removed. The figures below show an example (from Planck-Early-V[1]) of this process.
[[File:
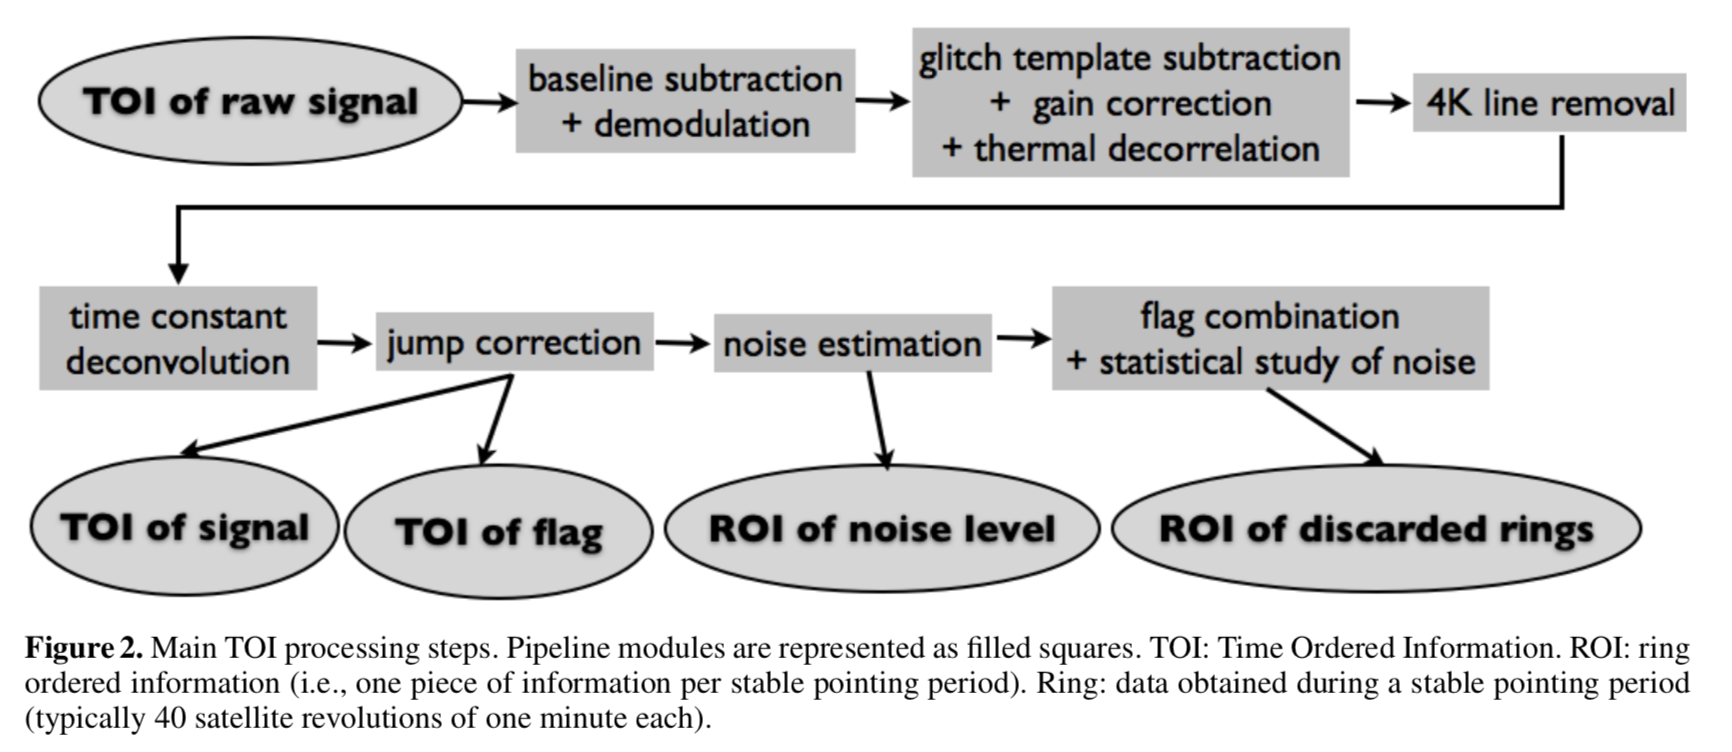
The cleaning process has evolved overtime and the measured noise characteristics have correspondingly changed. The diagram below (from Planck-Early-V[1] illustrates the main steps of the cleaning process.
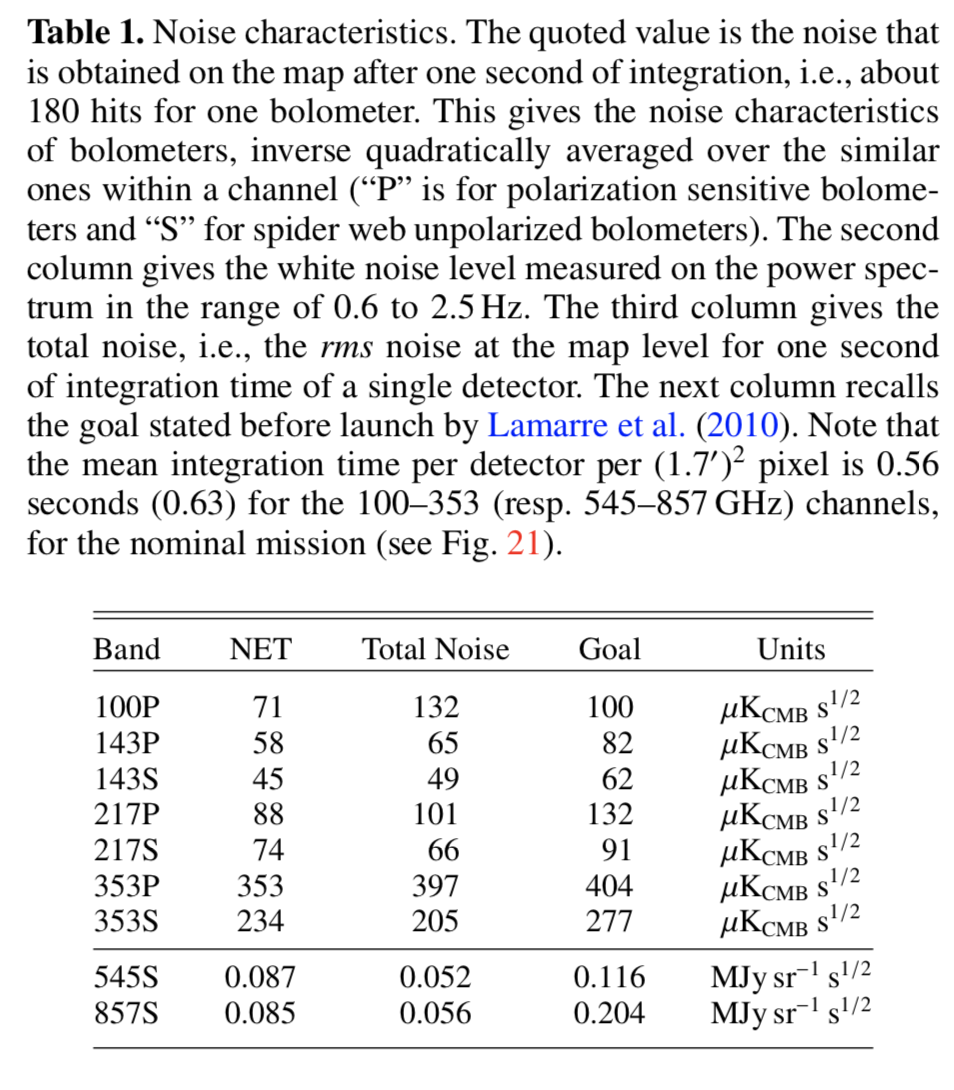
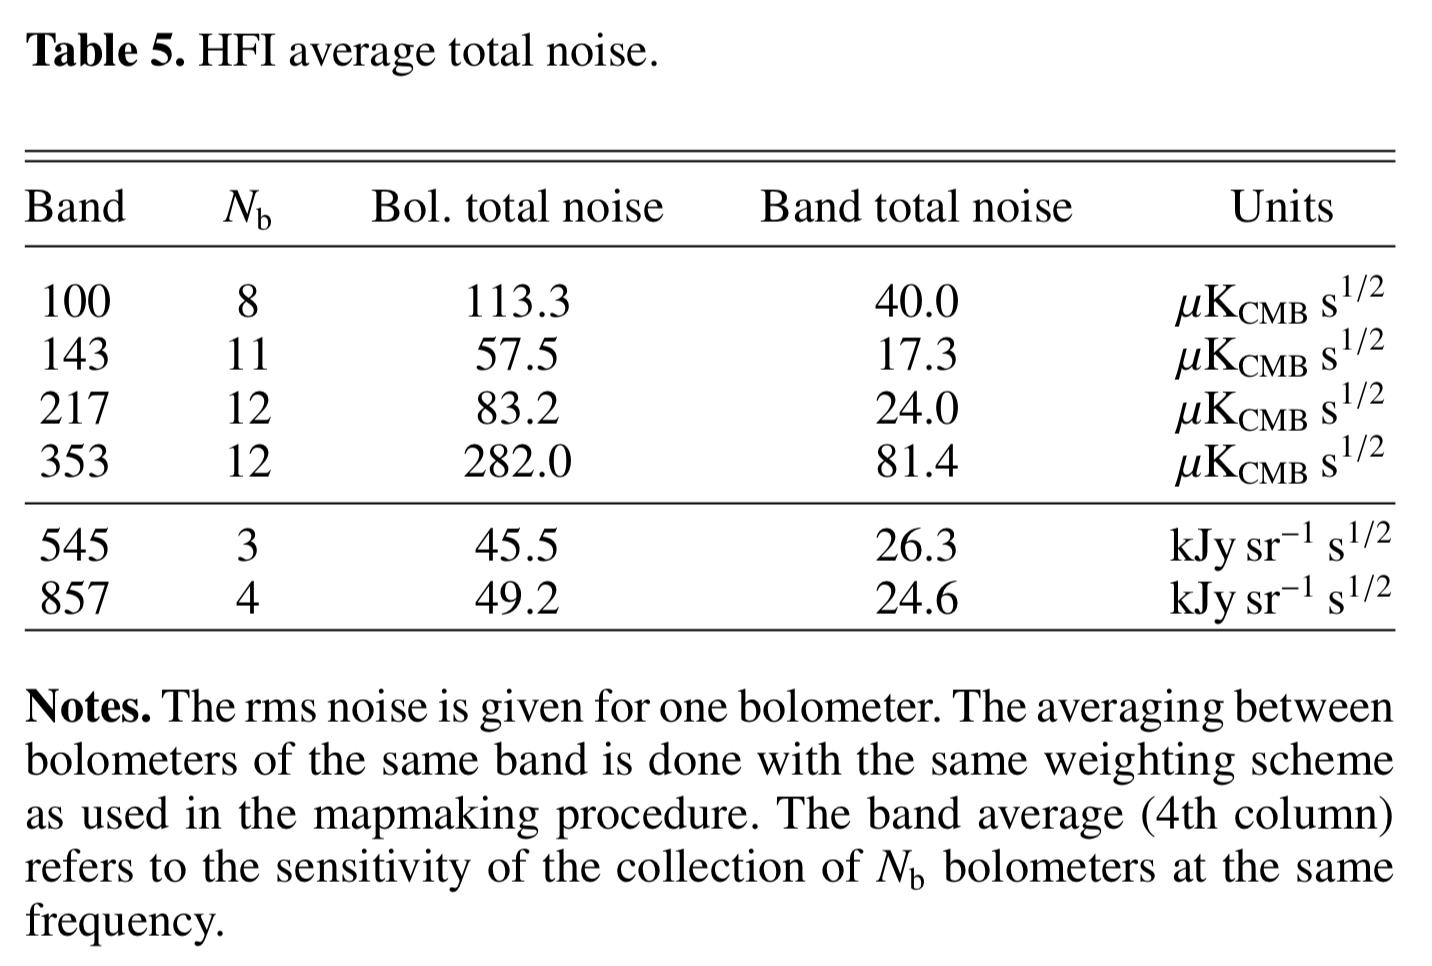
The two tables below give two snapshots of this evolution. The first table (from Planck-2013-XII[2]) applies to the 2013 release products, and the second table (from Planck-2015-A06[3]) applies to the 2015 and 2018 release products.
The essential characteristics of the HFI are gathered in the table below. The extreme sensitivity provided by the 100 mK bolometers and the HFI architecture provided a new view of the submillimetre and millimetre sky, with a noise level not far from the fundamental limits set by the photon noise of the observed source. However, expected and unexpected systematic effects were seen, the most noticeable of them being the spikes in the signal produced by cosmic rays hitting the bolometers and their immediate surroundings. The sensitivity here is obtained from the half difference of the half rings. The overall sensitivity for the 2013 release was around that announced as the goal in the "bluebook" [4] , i.e. 2 times better than the required sensitivity. These numbers improved by about √2 when the whole mission data become available.
| Frequency | 100 GHz | 143 GHz | 217 GHz | 353 GHz | 545 GHz | 857 GHz |
| Beam size [FWHM, arcmin] | 9.66 | 7.27 | 5.01 | 4.86 | 4.84 | 4.63 |
| Sensitivity per fiducial pixel | 3.95 µK/K | 2.35 µK/K | 4.58 µK/K | 15.17 µK/K | 0.013 MJy sr-1 (*) | 0.013 MJy sr-1 (*) |
| Goal sensitivity | 2.5 µK/K | 2.2 µK/K | 4.8 µK/K | 14.7 µK/K | 0.023 MJy sr-1 | 0.041 MJy sr-1 |
(*) These sensitivities are only valid for high Galactic latitude.
references[edit]
- ↑ 1.01.1 Planck early results. V. The Low Frequency Instrument data processing, A. Zacchei, D. Maino, C. Baccigalupi, et al. , A&A, 536, A5, (2011).
- ↑ Planck 2013 results. XI. Component separation, Planck Collaboration, 2014, A&A, 571, A11.
- ↑ Planck 2015 results. VI. LFI mapmaking, Planck Collaboration, 2016, A&A, 594, A6.
- ↑ The Scientific Programme of Planck, Planck Collaboration, ESA publication ESA-SCI(2005)/01, (2005).
(Planck) High Frequency Instrument
Full-Width-at-Half-Maximum
European Space Agency
