Difference between revisions of "Sky temperature maps"
(→LFI inputs) |
|||
| (187 intermediate revisions by 9 users not shown) | |||
| Line 1: | Line 1: | ||
| − | + | ==General description== | |
| − | = | ||
| − | |||
| − | |||
| − | Sky maps are provided for the nominal Planck mission and for the first two single surveys, the third one being covered only for a small part during the nominal mission | + | Sky maps give the best estimate of the intensity of the signal from the sky after removal, as far as possible, of known systematic effects and of the dipole signals induced by the motion of the solar system in the CMB and of the Planck satellite in the solar system. Sky maps are provided for the nominal Planck mission and also, separately, for the first two single surveys, the third one being covered only for a small part during the nominal mission.The details of the start and end times of each are given in [[HFIpreprocessingstatics | this table]]. As a secondary product, maps with estimates of the Zodiacal light and Far-Side-Lobes contribution removed are also provided. |
| − | { | + | For characterization purposes, are also provided maps covering the nominal survey but each one using only half of the available data. These are the ''ringhalf_{1|2}'' maps, which are built using the first and second half of the stable pointing part in each pointing period. These maps are used extensively to investigate the (high frequency) noise properties the maps themselves and of other products described elsewhere (see e.g., the [[HFI-Validation | data validation]] section). |
| − | | | + | |
| − | + | To help in further processing, there are also masks of the Galactic Plane and of point sources, each provided for several different depths. | |
| − | | | + | |
| − | + | All sky maps are in Healpix format, with Nside of 2048 for HFI and of 1024 for LFI (note that the LFI 70 GHz has been delivered also at Nside of 2048 to be directly comparable with HFI maps), in Galactic coordinates, and Nested ordering. The signal is given in units of K<sub>cmb</sub> for 30-353 GHz, and of MJy/sr (for a constant $\nu F_\nu$ energy distribution ) for 545 and 857 GHz. Each sky map is packaged into a ''BINTABLE'' extension of a FITS file together with a hit-count map (or hit map, for short, giving the number of observation samples that are cumulated in a pixel, all detectors combined) and a variance map (determined from the half-ring maps), and additional information is given in the FITS file header. The structure of the FITS file is given in the [[#Format | FITS file structure]] section below. | |
| − | |||
| − | |||
| − | |||
| − | |||
| − | |||
| − | |||
| − | |||
| − | |||
| − | |||
| − | |||
| − | |||
| − | |||
| − | |||
| − | |||
| − | |||
| − | |||
| − | |||
| − | |||
| − | |||
| − | |||
| − | |||
| − | |||
| − | | | ||
| − | |||
| − | |||
| − | |||
| − | + | ===Types of maps === | |
| − | + | ; Full channel maps | |
| − | + | : Full channel maps are built using all the valid detectors of a frequency channel and cover the nominal mission. For HFI, the 143-8 and 545-3 bolometers are rejected entirely as they are seriously affected by RTS noise. The maps are displayed in the figures below. The range is the same from 30 - 143 GHz in order to show the CMB at the same level. At higher frequencies the range is increased in order to keep the Galactic Plane from invading the whole sky. | |
| − | + | <center> | |
| + | <gallery style="padding:0 0 0 0;" perrow=3 widths=260px heights=160px> | ||
| + | File: SkyMap30.png| '''Nominal mission, 30 GHz''' | ||
| + | File: SkyMap44.png | '''Nominal mission, 44 GHz''' | ||
| + | File: SkyMap70.png | '''Nominal mission, 70 GHz''' | ||
| + | File: SkyMap100.png | '''Nominal mission, 100 GHz''' | ||
| + | File: SkyMap143.png | '''Nominal mission, 143 GHz''' | ||
| + | File: SkyMap217.png | '''Nominal mission, 217 GHz''' | ||
| + | File: SkyMap353.png | '''Nominal mission, 353 GHz''' | ||
| + | File: SkyMap545.png | '''Nominal mission, 545 GHz''' | ||
| + | File: SkyMap857.png | '''Nominal mission, 857 GHz''' | ||
| + | </gallery> | ||
| + | </center> | ||
| − | + | ; Single survey maps | |
| + | : Single survey maps are built using all valid detectors of a frequency channel; they cover separately the different sky surveys. The surveys are defined as the times over which the satellite spin axis rotates but 180 degrees, which, due to the position of the detectors in the focal plane does not cover the full sky, but a fraction between ~80 and 90% depending on detector position. | ||
| − | + | ; Detector set or detector pairs maps | |
| + | : These are maps built from a subset of the detectors in a frequency channel, typically our of two PSB pairs (i.e., four poloarisation-sensitive bolometers with different orientation on the sky), for HFI in order to extract a single temperature map. While none of these maps are part of the first Planck data release, the concept of ''detset'' is used, and thus it is worth mentioning it here. In particular, information by detector set is available at the [[Frequency_maps_angular_power_spectra | sky power spectrum]] level and in the [[The RIMO | RIMO]]. | ||
| − | + | ; Half-ring maps | |
| + | : Half-ring maps are built using only the first or the second half of the stable pointing period data. There are thus two half-ring maps per frequency channel named ''ringhalf_1'' and ''ringhalf_2'' respectively. These maps are built for characterization purposes in order to perform null tests. In particular, the difference between the two half-ring maps at a given frequency give a good estimate of the high frequency noise in the data (albeit biased low by ~0.5% for the HFI channels due to specifics of the TOI processing). | ||
| − | + | ; Masks | |
| + | : Masks are provided of the Galactic Plane and of the point sources. For the Galactic Plane, eight masks are given covering different fractions of the sky, and for the points sources two masks are given, at the 5 and 10 sigma level, for each Planck HFI frequency channel. These are generic masks, specific masks applicable to other products are delivered with the products themselves. | ||
=== Caveats and known issues === | === Caveats and known issues === | ||
| + | |||
| + | The primary limitation of the HFI maps are | ||
| + | * the absence of correction of the ADC non-linearities, | ||
| + | * the far-side lobe contribution is not accounted for in the processing and in the calibration, | ||
| + | * the dipole removal is based on the non-relativistic approximation which leaves a weak quadrupole component in the map. | ||
| + | And thus the overall calibration accuracy is at the 0.2% level in 100-217 GHz channels | ||
| + | |||
| + | The LFI 70 GHz maps at Nside=2048 should be considered as additional product, the default are the LFI maps at Nside=1024. No effective beam at Nside=2048 is provided, only at Nside=1024, for this reason the use of the effective beam with maps at Nside 2048 is discouraged. | ||
| + | |||
==== Map zero-level ==== | ==== Map zero-level ==== | ||
| − | + | For the 100 to 857 GHz maps, the zero levels are set to their optimal levels for Galactic and CIB studies. A procedure for adjusting them to astrophysical values is given in the HFI Calibration paper {{PlanckPapers|planck2013-p03b}}. | |
| − | + | ||
| + | For the 30, 44 and 70 GHz, maps are corrected for zero level monopole by applying an offset correction, see LFI Calibration paper {{PlanckPapers|planck2013-p02b}} section 3.4 "Setting the zero levels in the maps". Note that the offset applied is indicated in the header as a comment keyword. | ||
==== The Zodiacal light and the Far-Side Lobes ==== | ==== The Zodiacal light and the Far-Side Lobes ==== | ||
| − | < | + | The figures below show the modeled Zodiacal light and Far Side Lobes projected onto the maps; they are simply the difference between the ''main product'' and the ''ZodiCorrected'' maps for the nominal mission. The units are given in the figures. The ''heat'' color table has been used in place of the standard Planck for clarity reasons. |
| + | <center> | ||
| + | <gallery perrow=3 widths=260px heights=170px> | ||
| + | File: ZodiRes100.png | '''zodi/FSL rediduals - 100 GHz''' | ||
| + | File: ZodiRes143.png | '''zodi/FSL rediduals - 143 GHz''' | ||
| + | File: ZodiRes217.png | '''zodi/FSL rediduals - 217 GHz''' | ||
| + | File: ZodiRes353.png | '''zodi/FSL rediduals - 353 GHz''' | ||
| + | File: ZodiRes545.png | '''zodi/FSL rediduals - 545 GHz''' | ||
| + | File: ZodiRes857.png | '''zodi/FSL rediduals - 857 GHz''' | ||
| + | </gallery> | ||
| + | </center> | ||
| + | The effects of the FSLs are seen most clearly at the highest frequencies, as structures roughly symmetric about the center of the image, which corresponds to the location of the Galactic Centre, which is in turn the source of most of the radiation that is scattered into the FSLs. | ||
| + | |||
| + | ==== Artifacts near caustics of the scanning strategy ==== | ||
| − | + | The [[Survey scanning and performance|scanning strategy]] is such that regions around the Ecliptic poles are surveyed very deeply and compared to the average, and the transition from the nominal depth to the high depth, as shows on hit-count maps is very rapid, namely a few pixels, for a contrast of ~30. These transitions, or caustics in the maps, occur at different positions on the sky for different detectors, as the positions depend on their location in the focal plane of the instrument. As a result, when data from different detectors are combined to build a full channel map, the the weights of different detectors in the mix changes rapidly across the caustic, and given the remaining errors in the relative calibration of the detectors, a visible effect can be introduced in the maps, especially when the SNR is very high, i.e. at the highest frequencies and near bright regions like the Galactic Plane. Some examples are shown below. | |
| − | + | <center> | |
| + | <gallery perrow=3 heights=260px widths=260pix > | ||
| + | File: causta857.png | '''857 GHz intensity map around (272.5, -27)''' | ||
| + | File: caustb857.png | '''857 GHz intensity map around (264.5, -37.5)''' | ||
| + | File: caustc857.png | '''857 GHz intensity map around (98.5, 43)''' | ||
| + | File: hita857.png | '''857 GHz hit count map around (272.5, -27)''' | ||
| + | File: hitb857.png | '''857 GHz hit count map around (264.5, -37.5)''' | ||
| + | File: hitc857.png | '''857 GHz hit count map around (98.5, 43)''' | ||
| + | </gallery> | ||
| + | </center> | ||
==Production process== | ==Production process== | ||
| − | + | ||
| + | |||
Sky maps are produced by combining appropriately the data of all working detectors in a frequency channel over some period of the mission. They give the best estimate of the signal from the sky (unpolarised) after removal, as far as possible, of known systematic effects and of the dipole signals induced by the motion of the solar system in the CMB and of the Planck satellite in the solar system. In particular, they include the Zodiacal light emission (Zodi for short) and also the scattering from the far-side lobes of the beams (FSL). More on this below. | Sky maps are produced by combining appropriately the data of all working detectors in a frequency channel over some period of the mission. They give the best estimate of the signal from the sky (unpolarised) after removal, as far as possible, of known systematic effects and of the dipole signals induced by the motion of the solar system in the CMB and of the Planck satellite in the solar system. In particular, they include the Zodiacal light emission (Zodi for short) and also the scattering from the far-side lobes of the beams (FSL). More on this below. | ||
| + | |||
=== HFI processing === | === HFI processing === | ||
| Line 79: | Line 100: | ||
; dark template removal: the two dark bolometers are demodulated and despiked as above; the resulting timelines are then smoothed and used as an indicator of the overall temperature variations of the bolometer plate. Where the variations are consistent with each other, they are combined and removed from the bolometer signal timelines using appropriate coupling coefficients. The few percent of the data where they are not consistent are flagged on the timelines. | ; dark template removal: the two dark bolometers are demodulated and despiked as above; the resulting timelines are then smoothed and used as an indicator of the overall temperature variations of the bolometer plate. Where the variations are consistent with each other, they are combined and removed from the bolometer signal timelines using appropriate coupling coefficients. The few percent of the data where they are not consistent are flagged on the timelines. | ||
; conversion to absorbed power: the timeline is converted to watts of absorbed power using the bolometer function. This includes a non-linearity correction; removal of the 4K cooler lines: the electromagnetic interference of the 4K cooler with the bolometer readout wires induces some sharp lines in the signal power spectra at frequencies of the 4K cooler's fundamental and its multiples, folded by the signal modulations. Fourier coefficients of the relevant lines are determined on a per-ring basis, and then removed from the data. The quality of the removal depends on the bolometer. | ; conversion to absorbed power: the timeline is converted to watts of absorbed power using the bolometer function. This includes a non-linearity correction; removal of the 4K cooler lines: the electromagnetic interference of the 4K cooler with the bolometer readout wires induces some sharp lines in the signal power spectra at frequencies of the 4K cooler's fundamental and its multiples, folded by the signal modulations. Fourier coefficients of the relevant lines are determined on a per-ring basis, and then removed from the data. The quality of the removal depends on the bolometer. | ||
| − | |||
; deconvolution by the time transfer function: this is done to correct for the non-instantaneous time response of the bolometers. The function itself is modeled using 4 parameters which are adjusted primarily on the planet data and also from comparisons of the northward and southward scans of the Galactic Plane. It is then removed using Fourier techniques, which has the side-effect of increasing the noise at high frequencies. | ; deconvolution by the time transfer function: this is done to correct for the non-instantaneous time response of the bolometers. The function itself is modeled using 4 parameters which are adjusted primarily on the planet data and also from comparisons of the northward and southward scans of the Galactic Plane. It is then removed using Fourier techniques, which has the side-effect of increasing the noise at high frequencies. | ||
; jump correction: removes some (relatively rare: 0.3 jumps per bolometer per pointing period, on average) jumps in the signal baseline. The jumps are detected characterized on smoothed TOIs, and corrected by adding a constant to part of the signal timeline. The origin of the jumps is not known. | ; jump correction: removes some (relatively rare: 0.3 jumps per bolometer per pointing period, on average) jumps in the signal baseline. The jumps are detected characterized on smoothed TOIs, and corrected by adding a constant to part of the signal timeline. The origin of the jumps is not known. | ||
| − | The results of this processing are a timeline of signal (in absorbed watts) and a ''valid data'' flag timeline for each of the 50 valid bolometers processed; these timelines contain the full sky signal, i.e., including the solar and orbital dipoles, the Zodiacal light, and contributions from the Far-Side lobes. The dipoles are necessary for the flux calibration and are removed at the mapmaking stage. The remaining two bolometers (143-8 and 535-3) show semi-random jumps in the signal level, typically jumping over 2-5 different ''pseudo-baseline'' levels, a behavior known as ''Random Telegraphic Signal'', so that these are commonly called the RTS bolometers. Finally, ring-level statistics of different types (mean, median, rms, kurtosis, etc.) are determined on a per-ring basis for all timelines, and a selection based on these statistics is used to discard anomalous rings, which are recorded in a ring-level flag for each valid bolometer timeline. | + | The results of this processing are a timeline of signal (in absorbed watts) and a ''valid data'' flag timeline for each of the 50 valid bolometers processed; these timelines contain the full sky signal, i.e., including the solar and orbital dipoles, the Zodiacal light, and contributions from the Far-Side lobes. The dipoles are necessary for the flux calibration and are removed at the mapmaking stage. The remaining two bolometers (143-8 and 535-3) show semi-random jumps in the signal level, typically jumping over 2-5 different ''pseudo-baseline'' levels, a behavior known as ''Random Telegraphic Signal'', so that these are commonly called the RTS bolometers. Finally, ring-level statistics of different types (mean, median, rms, kurtosis, etc.) are determined on a per-ring basis for all timelines, and a selection based on these statistics is used to discard anomalous rings, which are recorded in a ring-level flag for each valid bolometer timeline (see the [[TOI_processing#Discarded_rings| Discarded rings]] section). |
Throughout this processing, bright planets (Mars, Jupiter, Saturn, Uranus) and bright asteroids are masked in the timeline in order to avoid ringing effects in the processing. Since they move on the sky, the portion of the sky masked during one survey is observed during one, and no hole is left in the final map. In parallel, the planet data are processed in a similar way, but with different parameters for the despiking step, and without the final jump correction step. These results are processed separately to determine the beam shapes and the focal plane geometry. | Throughout this processing, bright planets (Mars, Jupiter, Saturn, Uranus) and bright asteroids are masked in the timeline in order to avoid ringing effects in the processing. Since they move on the sky, the portion of the sky masked during one survey is observed during one, and no hole is left in the final map. In parallel, the planet data are processed in a similar way, but with different parameters for the despiking step, and without the final jump correction step. These results are processed separately to determine the beam shapes and the focal plane geometry. | ||
| + | The pointing is determined starting from the AHF produced by MOC, which gives the direction and orientation of the LOS of a fiducial position in the focal plane at frequencies of 8Hz during stable pointing and 4 Hz during maneuvers (TBC for details, reference). This is interpolated to the times of data observation (ref to method), corrected for the wobble and other time-dependent offsets determined from the observed positions of a large number of sources around the sky, and finally converted to the LOS of each detector using the quaternions in the IMO (which are determined from observations of bright planets - see the [[Detector_pointing]] section). | ||
| + | |||
| + | The mapmaking and calibration process is described in detail in the [[Map-making_LFI | Map-making]] section, where detailed references are found. In brief it consists of: | ||
| + | |||
| + | ; binning the TOI data onto ''rings'' : Healpix rings (HPRs) are used here, each ring containing the combined data of one pointing period. | ||
| + | ; flux calibration : at 100-353 GHz, the flux calibration factors are determined for each pointing period (or ring) from the solar-motion dipole, using the WMAP dipole as the reference, and after removal of the dipole signal induced by the motion of the Planck satellite in the solar system. This gain by ring is smoothed with a window of width 50 rings, which reveals an apparent variation of ~1-2% on a scale of 100s to 1000s of rings for the 100-217 GHz channels, and is applied. At 353GHz, where the solar motion dipole is weaker compared to the signal, no gain variation is detected (within the uncertainties), and a single fixed gain is applied to all rings. At 545 and 857 GHz the gain is determined from the observation of Uranus and Neptune (but not Jupiter which is too bright) and comparison to recent models made explicitly for this mission. A single gain is applied to all rings at these frequencies. | ||
| + | ; destriping : in order to remove low-frequency noise, an offset per ring is determined by minimizing the differences between HPRs at their crossings, and removed. | ||
| + | ; projection onto the map : the offset-corrected and flux-calibrated HPRs are projected onto Healpix maps, with the data of each bolometer weighted by a factor of 1/NET of that bolometer, and accounting for the slight different band transmission profiles of the bolometers in each band. | ||
| + | |||
| + | These maps provide the main mission products. A second, reduced, set of maps, cleaned of the Zodiacal emission of the FSL leakage is also produced for the nominal mission and the two single surveys, but not for the half-rings (since the contribution would be the same for the two halves of each ring). For this purpose, the the Zodiacal emission and the FSL contamination, which are not fixed on the sky, are modeled separately at HPR-level, and subtracted from the signal HPR before projecting them onto the maps. | ||
| + | |||
| + | Together with signal maps, hit count and variance maps are also produced. The hit maps give the (integer) number of valid TOI-level samples that contribute to the signal of each pixel. All valid samples are counted in the same way, i.e., there is no weighting factor applied. The variance maps project the white noise estimate, provided by the NETs, in the sky domain. | ||
| − | + | === LFI processing === | |
| + | LFI maps were constructed with the Madam map-making code, version 3.7.4. The code is based on generalized destriping technique, where the correlated noise component is modeled as a sequence of constant offset, called baselines. A noise filter was used to constrain the baseline solution allowing the use of 1 second baselines. | ||
| − | The | + | Radiometers were combined according to the horn-uniform weighting scheme to minimize systematics. The used weights are listed in [[Map-making LFI#Map-making|Map-making]]. The flagged samples were excluded from the analysis by setting their weights to $C_{w}^{-1}$ = 0. The galaxy region was masked out in the destriping phase, to reduce error arising from strong signal gradients. The polarization component was included in the analysis, although only the temperature maps are released. |
| − | + | A detailed description of the map-making procedure is given in {{PlanckPapers|planck2013-p02}} and in section [[Map-making LFI#Map-making|Map-making]]. | |
| − | + | ==Inputs== | |
| − | |||
| − | + | === HFI inputs === | |
| − | |||
| − | + | * The cleaned TOIs of signal of each detector, together with their flags, produced by the [[TOI processing|TOI processing]] pipeline | |
| + | * The TOIs of pointing (quaternions), described in [[Detector_pointing]] | ||
| + | * Bolometer-level characterization data, from the DPC's internal IMO (not distributed) | ||
| + | * Planck orbit data used to compute and remove the earth dipole | ||
| + | * WMAP solar dipole information used to calibrate the CMB channels | ||
| + | * Planet models used to calibrate the Galactic channels. | ||
| − | + | === LFI inputs === | |
| − | + | The Madam map-maker takes as an input: | |
| − | LFI | + | * The calibrated timelines (for details see [[TOI processing LFI|TOI Processing]]) |
| + | * The detector pointings (for details see [[Detector pointing|Detector pointing]]) | ||
| + | * The noise information in the form of three-parameter (white noise level ($\sigma$), slope, and knee frequency ($f_\mathrm{knee}$)) noise model (for details see [[The RIMO|RIMO]]) | ||
| − | |||
| − | |||
==Related products== | ==Related products== | ||
| − | |||
| − | |||
| − | |||
| − | |||
| − | |||
| − | |||
| − | |||
| − | |||
| + | === Masks === | ||
| + | Masks are provided of | ||
| − | < | + | ; the point sources |
| + | : 15 masks are provided, three for the LFI (one mask for each frequency masking at the 4<math>\sigma</math> level) and 12 for the HFI (two masks for each frequency at the 5 and 10<math>\sigma</math> levels. For the HFI the masks can be used as they are, for the LFI they need to be downgraded to Nside=1024 except for the 70 GHz channel at Nside=2048 which does not need to be downgraded. | ||
| − | + | ; the Galactic Plane | |
| + | : 8 masks are provided giving 20, 40, 60, 70, 80, 90, 97, and 99% sky coverage in two different files, at Nside=2048. For the HFI they can be used as they are, for the LFI they need to be downgraded at Nside=1024 (note that if using the 70 GHZ at Nside=2048 no downgraded is needed) | ||
| − | |||
| − | + | The masks are binary, in GALACTIC coordinates, and NESTED ordering. The table below give the filenames. | |
| − | |||
| − | |||
| − | |||
| − | |||
| − | |||
| − | |||
| − | |||
| − | |||
| − | |||
| − | |||
{| class="wikitable" align="center" style="text-align:center" border="1" cellpadding="5" cellspacing="0" | {| class="wikitable" align="center" style="text-align:center" border="1" cellpadding="5" cellspacing="0" | ||
| − | |+ ''' | + | |+ '''FITS filenames for masks''' |
| − | | | + | |-bgcolor="ffdead" |
| + | ! Frequency || LFI Point Source masks | ||
|- | |- | ||
| − | | ''' | + | | '''30GHz''' || {{PLASingleFile|fileType=map|name=LFI_MASK_030-ps_2048_R1.00.fits|link=LFI_MASK_030-ps_2048_R1.00.fits}} |
|- | |- | ||
| − | | ''' | + | | '''44GHz''' || {{PLASingleFile|fileType=map|name=LFI_MASK_044-ps_2048_R1.00.fits|link=LFI_MASK_044-ps_2048_R1.00.fits}} |
|- | |- | ||
| − | | ''' | + | | '''70GHz''' || {{PLASingleFile|fileType=map|name=LFI_MASK_070-ps_2048_R1.00.fits|link=LFI_MASK_070-ps_2048_R1.00.fits}} |
| + | |- bgcolor="ffdead" | ||
| + | ! colspan="2" | HFI Point Source masks | ||
|- | |- | ||
| − | | | + | | colspan="2" | {{PLASingleFile|fileType=map|name=HFI_Mask_PointSrc_2048_R1.10.fits|link=HFI_Mask_PointSrc_2048_R1.10.fits}} |
| + | |- bgcolor="ffdead" | ||
| + | ! colspan="2" | Galactic Plane masks | ||
| + | |- | ||
| + | | colspan="2" | {{PLASingleFile|fileType=map|name=HFI_Mask_GalPlane_2048_R1.10.fits|link=HFI_Mask_GalPlane_2048_R1.10.fits}} | ||
|} | |} | ||
| − | |||
| − | + | The masks are shows below in a single figure. While this is quite clear for the Galactic Plane masks, it is less so for the point source masks, but it does give a clear perspective on how the latter are distributed over the sky. | |
| − | + | <center> | |
| + | <gallery perrow=2 widths=300px heights=185px > | ||
| + | File: HFI_GalPlaneMask.png | '''Galactic Plane masks''' | ||
| + | File: HFI_PointSrcMask.png | '''PointSource masks''' | ||
| + | </gallery> | ||
| + | </center> | ||
| − | + | == File names == | |
| − | |||
| − | |||
| − | |||
| − | |||
| − | |||
| − | |||
| − | |||
| − | |||
| − | + | The FITS filenames are of the form ''{H|L}FI_SkyMap_fff_nnnn_R1.nn_{coverage}_{type}.fits'', where ''fff'' are three digits to indicate the Planck frequency band, and ''nnnn'' is the Healpix Nside of the map, ''coverage'' indicates which part of the mission is covered, and the optional ''type'' indicates the subset of input data used. A full list of products, with links to them in the Archive, is given in the tables below. | |
| − | + | ||
| − | HFI_SkyMap_100_2048_R1. | + | For the benefit of users who are only looking for the frequency maps with no additional information, we also provide a file combining the 9 frequency maps as separate columns in a single extension. The 9 columns in this file contain the intensity maps ONLY and no other information (hit maps and variance maps) is provided. |
| − | + | ||
| − | HFI_SkyMap_217_2048_R1. | + | {| class="wikitable" align="center" style="text-align:center" border="1" cellpadding="5" cellspacing="0" width=500px |
| − | + | |+ '''FITS filenames''' | |
| − | + | |- bgcolor="ffdead" | |
| − | + | ! Frequency || Full channel maps | |
| − | HFI_SkyMap_100_2048_R1. | + | |- |
| − | + | | '''30GHz''' || {{PLASingleFile|fileType=map|name=LFI_SkyMap_030_1024_R1.10_nominal.fits|link=LFI_SkyMap_030_1024_R1.10_nominal.fits}} | |
| − | HFI_SkyMap_217_2048_R1. | + | |- |
| − | + | | '''44GHz''' || {{PLASingleFile|fileType=map|name=LFI_SkyMap_044_1024_R1.10_nominal.fits|link=LFI_SkyMap_044_1024_R1.10_nominal.fits}} | |
| − | + | |- | |
| − | + | | '''70GHz''' || {{PLASingleFile|fileType=map|name=LFI_SkyMap_070_1024_R1.10_nominal.fits|link=LFI_SkyMap_070_1024_R1.10_nominal.fits}} | |
| + | |- | ||
| + | | '''70GHz''' || {{PLASingleFile|fileType=map|name=LFI_SkyMap_070_2048_R1.10_nominal.fits|link=LFI_SkyMap_070_2048_R1.10_nominal.fits}} | ||
| + | |- | ||
| + | | '''100GHz''' || {{PLASingleFile|fileType=map|name=HFI_SkyMap_100_2048_R1.10_nominal.fits|link=HFI_SkyMap_100_2048_R1.10_nominal.fits}} | ||
| + | |- | ||
| + | | '''143GHz''' || {{PLASingleFile|fileType=map|name=HFI_SkyMap_143_2048_R1.10_nominal.fits|link=HFI_SkyMap_143_2048_R1.10_nominal.fits}} | ||
| + | |- | ||
| + | | '''217GHz''' || {{PLASingleFile|fileType=map|name=HFI_SkyMap_217_2048_R1.10_nominal.fits|link=HFI_SkyMap_217_2048_R1.10_nominal.fits}} | ||
| + | |- | ||
| + | | '''353GHz''' || {{PLASingleFile|fileType=map|name=HFI_SkyMap_353_2048_R1.10_nominal.fits|link=HFI_SkyMap_353_2048_R1.10_nominal.fits}} | ||
| + | |- | ||
| + | | '''545GHz''' || {{PLASingleFile|fileType=map|name=HFI_SkyMap_545_2048_R1.10_nominal.fits|link=HFI_SkyMap_545_2048_R1.10_nominal.fits}} | ||
| + | |- | ||
| + | | '''857GHz''' || {{PLASingleFile|fileType=map|name=HFI_SkyMap_857_2048_R1.10_nominal.fits|link=HFI_SkyMap_857_2048_R1.10_nominal.fits}} | ||
| + | |- bgcolor="ffdead" | ||
| + | ! Frequency || Full channel, Zodi-corrected maps | ||
| + | |- | ||
| + | | '''100GHz''' || {{PLASingleFile|fileType=map|name=HFI_SkyMap_100_2048_R1.10_nominal_ZodiCorrected.fits|link=HFI_SkyMap_100_2048_R1.10_nominal_ZodiCorrected.fits}} | ||
| + | |- | ||
| + | | '''143GHz''' || {{PLASingleFile|fileType=map|name=HFI_SkyMap_143_2048_R1.10_nominal_ZodiCorrected.fits|link=HFI_SkyMap_143_2048_R1.10_nominal_ZodiCorrected.fits}} | ||
| + | |- | ||
| + | | '''217GHz''' || {{PLASingleFile|fileType=map|name=HFI_SkyMap_217_2048_R1.10_nominal_ZodiCorrected.fits|link=HFI_SkyMap_217_2048_R1.10_nominal_ZodiCorrected.fits}} | ||
| + | |- | ||
| + | | '''353GHz''' || {{PLASingleFile|fileType=map|name=HFI_SkyMap_353_2048_R1.10_nominal_ZodiCorrected.fits|link=HFI_SkyMap_353_2048_R1.10_nominal_ZodiCorrected.fits}} | ||
| + | |- | ||
| + | | '''545GHz''' || {{PLASingleFile|fileType=map|name=HFI_SkyMap_545_2048_R1.10_nominal_ZodiCorrected.fits|link=HFI_SkyMap_545_2048_R1.10_nominal_ZodiCorrected.fits}} | ||
| + | |- | ||
| + | | '''857GHz''' || {{PLASingleFile|fileType=map|name=HFI_SkyMap_857_2048_R1.10_nominal_ZodiCorrected.fits|link=HFI_SkyMap_857_2048_R1.10_nominal_ZodiCorrected.fits}} | ||
| + | |- bgcolor="ffdead" | ||
| + | ! Frequency || Combined frequency maps | ||
| + | |- | ||
| + | | '''All''' || {{PLASingleFile|fileType=file|name=COM_MapSet_I-allFreqs_R1.10_nominal.fits|link=COM_MapSet_I-allFreqs_R1.10_nominal.fits}} | ||
| + | |} | ||
| − | + | {| class="wikitable" align="center" style="text-align:center" border="1" cellpadding="5" cellspacing="0" width=850px | |
| − | + | |+ '''FITS filenames''' | |
| − | HFI_SkyMap_100_2048_R1. | + | |- bgcolor="ffdead" |
| − | + | ! Frequency || Survey 1 maps || Survey 2 maps | |
| − | + | |- | |
| − | + | | '''30GHz''' || {{PLASingleFile|fileType=map|name=LFI_SkyMap_030_1024_R1.10_survey_1.fits|link=LFI_SkyMap_030_1024_R1.10_survey_1.fits}} || | |
| − | + | {{PLASingleFile|fileType=map|name=LFI_SkyMap_030_1024_R1.10_survey_2.fits|link=LFI_SkyMap_030_1024_R1.10_survey_2.fits}} | |
| − | + | |- | |
| − | HFI_SkyMap_100_2048_R1. | + | | '''44GHz''' || {{PLASingleFile|fileType=map|name=LFI_SkyMap_044_1024_R1.10_survey_1.fits|link=LFI_SkyMap_044_1024_R1.10_survey_1.fits}} || |
| − | HFI_SkyMap_143_2048_R1. | + | {{PLASingleFile|fileType=map|name=LFI_SkyMap_044_1024_R1.10_survey_2.fits|link=LFI_SkyMap_044_1024_R1.10_survey_2.fits}} |
| − | HFI_SkyMap_217_2048_R1. | + | |- |
| − | HFI_SkyMap_353_2048_R1. | + | | '''70GHz''' || {{PLASingleFile|fileType=map|name=LFI_SkyMap_070_1024_R1.10_survey_1.fits|link=LFI_SkyMap_070_1024_R1.10_survey_1.fits}} || |
| − | HFI_SkyMap_545_2048_R1. | + | {{PLASingleFile|fileType=map|name=LFI_SkyMap_070_1024_R1.10_survey_2.fits|link=LFI_SkyMap_070_1024_R1.10_survey_2.fits}} |
| − | HFI_SkyMap_857_2048_R1. | + | |- |
| + | | '''70GHz''' || {{PLASingleFile|fileType=map|name=LFI_SkyMap_070_2048_R1.10_survey_1.fits|link=LFI_SkyMap_070_2048_R1.10_survey_1.fits}} || | ||
| + | {{PLASingleFile|fileType=map|name=LFI_SkyMap_070_2048_R1.10_survey_2.fits|link=LFI_SkyMap_070_2048_R1.10_survey_2.fits}} | ||
| + | |- | ||
| + | | '''100GHz''' || {{PLASingleFile|fileType=map|name=HFI_SkyMap_100_2048_R1.10_survey_1.fits|link=HFI_SkyMap_100_2048_R1.10_survey_1.fits}} || | ||
| + | {{PLASingleFile|fileType=map|name=HFI_SkyMap_100_2048_R1.10_survey_2.fits|link=HFI_SkyMap_100_2048_R1.10_survey_2.fits}} | ||
| + | |- | ||
| + | | '''143GHz''' || {{PLASingleFile|fileType=map|name=HFI_SkyMap_143_2048_R1.10_survey_1.fits|link=HFI_SkyMap_143_2048_R1.10_survey_1.fits}} || | ||
| + | {{PLASingleFile|fileType=map|name=HFI_SkyMap_143_2048_R1.10_survey_2.fits|link=HFI_SkyMap_143_2048_R1.10_survey_2.fits}} | ||
| + | |- | ||
| + | | '''217GHz''' || {{PLASingleFile|fileType=map|name=HFI_SkyMap_217_2048_R1.10_survey_1.fits|link=HFI_SkyMap_217_2048_R1.10_survey_1.fits}} || | ||
| + | {{PLASingleFile|fileType=map|name=HFI_SkyMap_217_2048_R1.10_survey_2.fits|link=HFI_SkyMap_217_2048_R1.10_survey_2.fits}} | ||
| + | |- | ||
| + | | '''353GHz''' || {{PLASingleFile|fileType=map|name=HFI_SkyMap_353_2048_R1.10_survey_1.fits|link=HFI_SkyMap_353_2048_R1.10_survey_1.fits}} || | ||
| + | {{PLASingleFile|fileType=map|name=HFI_SkyMap_353_2048_R1.10_survey_2.fits|link=HFI_SkyMap_353_2048_R1.10_survey_2.fits}} | ||
| + | |- | ||
| + | | '''545GHz''' || {{PLASingleFile|fileType=map|name=HFI_SkyMap_545_2048_R1.10_survey_1.fits|link=HFI_SkyMap_545_2048_R1.10_survey_1.fits}} || | ||
| + | {{PLASingleFile|fileType=map|name=HFI_SkyMap_545_2048_R1.10_survey_2.fits|link=HFI_SkyMap_545_2048_R1.10_survey_2.fits}} | ||
| + | |- | ||
| + | | '''857GHz''' || {{PLASingleFile|fileType=map|name=HFI_SkyMap_857_2048_R1.10_survey_1.fits|link=HFI_SkyMap_857_2048_R1.10_survey_1.fits}} || | ||
| + | {{PLASingleFile|fileType=map|name=HFI_SkyMap_857_2048_R1.10_survey_2.fits|link=HFI_SkyMap_857_2048_R1.10_survey_2.fits}} | ||
| + | |- bgcolor="ffdead" | ||
| + | ! Frequency || Survey 1 Zodi-corrected maps || Survey 2 Zodi-corrected maps | ||
| + | |- | ||
| + | | '''100GHz''' || {{PLASingleFile|fileType=map|name=HFI_SkyMap_100_2048_R1.10_survey_1_ZodiCorrected.fits|link=HFI_SkyMap_100_2048_R1.10_survey_1_ZodiCorrected.fits}} || | ||
| + | {{PLASingleFile|fileType=map|name=HFI_SkyMap_100_2048_R1.10_survey_2_ZodiCorrected.fits|link=HFI_SkyMap_100_2048_R1.10_survey_2_ZodiCorrected.fits}} | ||
| + | |- | ||
| + | | '''143GHz''' || {{PLASingleFile|fileType=map|name=HFI_SkyMap_143_2048_R1.10_survey_1_ZodiCorrected.fits|link=HFI_SkyMap_143_2048_R1.10_survey_1_ZodiCorrected.fits}} || | ||
| + | {{PLASingleFile|fileType=map|name=HFI_SkyMap_143_2048_R1.10_survey_2_ZodiCorrected.fits|link=HFI_SkyMap_143_2048_R1.10_survey_2_ZodiCorrected.fits}} | ||
| + | |- | ||
| + | | '''217GHz''' || {{PLASingleFile|fileType=map|name=HFI_SkyMap_217_2048_R1.10_survey_1_ZodiCorrected.fits|link=HFI_SkyMap_217_2048_R1.10_survey_1_ZodiCorrected.fits}} || | ||
| + | {{PLASingleFile|fileType=map|name=HFI_SkyMap_217_2048_R1.10_survey_2_ZodiCorrected.fits|link=HFI_SkyMap_217_2048_R1.10_survey_2_ZodiCorrected.fits}} | ||
| + | |- | ||
| + | | '''353GHz''' || {{PLASingleFile|fileType=map|name=HFI_SkyMap_353_2048_R1.10_survey_1_ZodiCorrected.fits|link=HFI_SkyMap_353_2048_R1.10_survey_1_ZodiCorrected.fits}} || | ||
| + | {{PLASingleFile|fileType=map|name=HFI_SkyMap_353_2048_R1.10_survey_2_ZodiCorrected.fits|link=HFI_SkyMap_353_2048_R1.10_survey_2_ZodiCorrected.fits}} | ||
| + | |- | ||
| + | | '''545GHz''' || {{PLASingleFile|fileType=map|name=HFI_SkyMap_545_2048_R1.10_survey_1_ZodiCorrected.fits|link=HFI_SkyMap_545_2048_R1.10_survey_1_ZodiCorrected.fits}} || | ||
| + | {{PLASingleFile|fileType=map|name=HFI_SkyMap_545_2048_R1.10_survey_2_ZodiCorrected.fits|link=HFI_SkyMap_545_2048_R1.10_survey_2_ZodiCorrected.fits}} | ||
| + | |- | ||
| + | | '''857GHz''' || {{PLASingleFile|fileType=map|name=HFI_SkyMap_857_2048_R1.10_survey_1_ZodiCorrected.fits|link=HFI_SkyMap_857_2048_R1.10_survey_1_ZodiCorrected.fits}} || | ||
| + | {{PLASingleFile|fileType=map|name=HFI_SkyMap_857_2048_R1.10_survey_2_ZodiCorrected.fits|link=HFI_SkyMap_857_2048_R1.10_survey_2_ZodiCorrected.fits}} | ||
| + | |- bgcolor="ffdead" | ||
| + | ! Frequency || Half-ring 1 maps ||Half-ring 2 maps | ||
| + | |- | ||
| + | | '''30GHz''' || {{PLASingleFile|fileType=map|name=LFI_SkyMap_030_1024_R1.10_nominal_ringhalf_1.fits|link=LFI_SkyMap_030_1024_R1.10_nominal_ringhalf_1.fits}} || | ||
| + | {{PLASingleFile|fileType=map|name=LFI_SkyMap_030_1024_R1.10_nominal_ringhalf_2.fits|link=LFI_SkyMap_030_1024_R1.10_nominal_ringhalf_2.fits}} | ||
| + | |- | ||
| + | | '''44GHz''' || {{PLASingleFile|fileType=map|name=LFI_SkyMap_044_1024_R1.10_nominal_ringhalf_1.fits|link=LFI_SkyMap_044_1024_R1.10_nominal_ringhalf_1.fits}} || | ||
| + | {{PLASingleFile|fileType=map|name=LFI_SkyMap_044_1024_R1.10_nominal_ringhalf_2.fits|link=LFI_SkyMap_044_1024_R1.10_nominal_ringhalf_2.fits}} | ||
| + | |- | ||
| + | | '''70GHz''' || {{PLASingleFile|fileType=map|name=LFI_SkyMap_070_1024_R1.10_nominal_ringhalf_1.fits|link=LFI_SkyMap_070_1024_R1.10_nominal_ringhalf_1.fits}} || | ||
| + | {{PLASingleFile|fileType=map|name=LFI_SkyMap_070_1024_R1.10_nominal_ringhalf_2.fits|link=LFI_SkyMap_070_1024_R1.10_nominal_ringhalf_2.fits}} | ||
| + | |- | ||
| + | | '''70GHz''' || {{PLASingleFile|fileType=map|name=LFI_SkyMap_070_2048_R1.10_nominal_ringhalf_1.fits|link=LFI_SkyMap_070_2048_R1.10_nominal_ringhalf_1.fits}} || | ||
| + | {{PLASingleFile|fileType=map|name=LFI_SkyMap_070_2048_R1.10_nominal_ringhalf_2.fits|link=LFI_SkyMap_070_2048_R1.10_nominal_ringhalf_2.fits}} | ||
| + | |- | ||
| + | | '''100GHz''' || {{PLASingleFile|fileType=map|name=HFI_SkyMap_100_2048_R1.10_nominal_ringhalf_1.fits|link=HFI_SkyMap_100_2048_R1.10_nominal_ringhalf_1.fits}} || | ||
| + | {{PLASingleFile|fileType=map|name=HFI_SkyMap_100_2048_R1.10_nominal_ringhalf_2.fits|link=HFI_SkyMap_100_2048_R1.10_nominal_ringhalf_2.fits}} | ||
| + | |- | ||
| + | | '''143GHz''' || {{PLASingleFile|fileType=map|name=HFI_SkyMap_143_2048_R1.10_nominal_ringhalf_1.fits|link=HFI_SkyMap_143_2048_R1.10_nominal_ringhalf_1.fits}} || | ||
| + | {{PLASingleFile|fileType=map|name=HFI_SkyMap_143_2048_R1.10_nominal_ringhalf_2.fits|link=HFI_SkyMap_143_2048_R1.10_nominal_ringhalf_2.fits}} | ||
| + | |- | ||
| + | | '''217GHz''' || {{PLASingleFile|fileType=map|name=HFI_SkyMap_217_2048_R1.10_nominal_ringhalf_1.fits|link=HFI_SkyMap_217_2048_R1.10_nominal_ringhalf_1.fits}} || | ||
| + | {{PLASingleFile|fileType=map|name=HFI_SkyMap_217_2048_R1.10_nominal_ringhalf_2.fits|link=HFI_SkyMap_217_2048_R1.10_nominal_ringhalf_2.fits}} | ||
| + | |- | ||
| + | | '''353GHz''' || {{PLASingleFile|fileType=map|name=HFI_SkyMap_353_2048_R1.10_nominal_ringhalf_1.fits|link=HFI_SkyMap_353_2048_R1.10_nominal_ringhalf_1.fits}} || | ||
| + | {{PLASingleFile|fileType=map|name=HFI_SkyMap_353_2048_R1.10_nominal_ringhalf_2.fits|link=HFI_SkyMap_353_2048_R1.10_nominal_ringhalf_2.fits}} | ||
| + | |- | ||
| + | | '''545GHz''' || {{PLASingleFile|fileType=map|name=HFI_SkyMap_545_2048_R1.10_nominal_ringhalf_1.fits|link=HFI_SkyMap_545_2048_R1.10_nominal_ringhalf_1.fits}} || | ||
| + | {{PLASingleFile|fileType=map|name=HFI_SkyMap_545_2048_R1.10_nominal_ringhalf_2.fits|link=HFI_SkyMap_545_2048_R1.10_nominal_ringhalf_2.fits}} | ||
| + | |- | ||
| + | | '''857GHz''' || {{PLASingleFile|fileType=map|name=HFI_SkyMap_857_2048_R1.10_nominal_ringhalf_1.fits|link=HFI_SkyMap_857_2048_R1.10_nominal_ringhalf_1.fits}} || | ||
| + | {{PLASingleFile|fileType=map|name=HFI_SkyMap_857_2048_R1.10_nominal_ringhalf_2.fits|link=HFI_SkyMap_857_2048_R1.10_nominal_ringhalf_2.fits}} | ||
| + | |} | ||
| − | + | == FITS file structure == | |
| − | |||
| − | |||
| − | |||
| − | |||
| − | |||
| − | |||
| − | |||
| − | |||
| − | |||
| − | |||
| − | |||
| − | |||
| − | |||
| − | |||
| − | |||
| − | |||
| − | |||
| − | |||
| + | [[File:FITS_FreqMap.png | 500px | right | thumb | '''FITS file structure''']] | ||
| − | + | The FITS files for the sky maps contain a minimal primary header with no data, and a ''BINTABLE'' extension (EXTENSION 1, EXTNAME = ''FREQ-MAP'') containing the data. The structure is shows schematically in the figure at right. | |
| − | + | The ''FREQ-MAP'' extension contains is a 3-column table that contain the signal, hit-count and variance maps, all in Healpix format, in columns 1, 2, and 3, respectively. The number of rows is 50331648 for HFI and LFI 70 GHz at Nside=2048 and 12582912 for LFI maps at Nside=1024 (N.B: Npix = 12 Nside^2). The three columns are ''I_STOKES'' for the intensity (or temperature) signal, ''HIT'' for the hit-count and ''II_COV'' for the variance. The exact order of the columns in the figure is indicative only, and the details can be found in the keywords. | |
| − | |||
| − | |||
| − | |||
| − | |||
| − | |||
| − | |||
| − | |||
| − | |||
| − | |||
| − | |||
| − | |||
| − | |||
| − | |||
| − | |||
| − | + | Keywords indicate the coordinate system (GALACTIC), the Healpix ordering scheme (NESTED), the units (K_cmb or MJy/sr) of each column, and of course the frequency channel (FREQ). The COMMENT fields give a one-line summary of the product, and some other information useful for traceability within the DPCs. The original filename is also given in the ''FILENAME'' keyword as are the datasum and the md5 checksum for the extension. The ''BAD_DATA'' keyword gives the value used by Healpix to indicate pixels for which no signal is present (these will also have a hit-count value of 0). The COMMENT fields give further information including some traceability data for the DPC's. The main parameters are summarised below: | |
| + | {| border="1" cellpadding="3" cellspacing="0" align="center" style="text-align:left" width=800px | ||
| + | |+ '''Sky map file data structure''' | ||
| + | |- bgcolor="ffdead" | ||
| + | !colspan="4" | 1. EXTNAME = 'FREQ-MAP' : Data columns | ||
| + | |- bgcolor="ffdead" | ||
| + | ! Column Name || Data Type || Units || Description | ||
| + | |- | ||
| + | |I_STOKES || Real*4 || K_cmb or MJy/sr || The signal map | ||
| + | |- | ||
| + | |HITS || Int*4 || none || The hit-count map | ||
| + | |- | ||
| + | |II_COV || Real*4 || K_cmb<sup>2</sup> or (MJy/sr)<sup>2</sup> || The variance map | ||
| + | |- bgcolor="ffdead" | ||
| + | ! Keyword || Data Type || Value || Description | ||
| + | |- | ||
| + | |PIXTYPE || string || HEALPIX || | ||
| + | |- | ||
| + | |COORDSYS || string || GALACTIC ||Coordinate system | ||
| + | |- | ||
| + | |ORDERING || string || NESTED || Healpix ordering | ||
| + | |- | ||
| + | |NSIDE || Int || 1024 or 2048 || Healpix Nside | ||
| + | |- | ||
| + | |FIRSTPIX || Int*4 || 0 || First pixel number | ||
| + | |- | ||
| + | |LASTPIX || Int*4 || 12582911 or 50331647 || Last pixel number | ||
| + | |- | ||
| + | |FREQ || string || nnn || The frequency channel | ||
| + | |} | ||
| − | |||
| − | + | The same structure applies to all ''SkyMap'' products, independent of whether they are full channel, survey of half-ring. The distinction between the types of maps is present in the FITS filename (and in the traceability comment fields). | |
| − | + | == References == | |
| − | |||
| − | |||
| − | |||
| − | |||
| − | |||
| − | |||
| − | |||
| − | |||
| − | |||
| − | |||
| − | |||
| − | |||
| − | |||
| − | + | <References /> | |
| − | |||
| − | |||
| − | |||
| − | |||
| − | |||
| − | |||
| − | |||
| − | |||
| − | |||
| − | |||
| − | |||
| − | |||
| − | |||
| − | |||
| − | |||
| − | |||
| − | |||
| − | |||
| − | |||
| − | |||
| − | |||
| − | |||
| − | |||
| − | |||
| − | |||
| − | |||
| − | |||
| − | |||
| − | |||
| − | |||
| − | |||
| − | |||
| − | |||
| − | |||
| − | |||
| − | |||
| − | |||
| − | |||
| − | |||
| − | |||
| − | |||
| − | |||
| − | |||
| − | |||
| − | |||
| − | |||
| − | |||
| − | |||
| − | |||
| − | |||
| − | |||
| − | |||
| − | |||
| − | |||
| − | |||
| − | |||
| − | |||
| − | |||
| − | |||
| − | |||
| − | |||
| − | |||
| − | |||
| − | |||
| − | |||
| − | |||
| − | |||
| − | [[Category:Mission | + | [[Category:Mission products|002]] |
Latest revision as of 13:00, 24 July 2014
Contents
General description[edit]
Sky maps give the best estimate of the intensity of the signal from the sky after removal, as far as possible, of known systematic effects and of the dipole signals induced by the motion of the solar system in the CMB and of the Planck satellite in the solar system. Sky maps are provided for the nominal Planck mission and also, separately, for the first two single surveys, the third one being covered only for a small part during the nominal mission.The details of the start and end times of each are given in this table. As a secondary product, maps with estimates of the Zodiacal light and Far-Side-Lobes contribution removed are also provided.
For characterization purposes, are also provided maps covering the nominal survey but each one using only half of the available data. These are the ringhalf_{1|2} maps, which are built using the first and second half of the stable pointing part in each pointing period. These maps are used extensively to investigate the (high frequency) noise properties the maps themselves and of other products described elsewhere (see e.g., the data validation section).
To help in further processing, there are also masks of the Galactic Plane and of point sources, each provided for several different depths.
All sky maps are in Healpix format, with Nside of 2048 for HFI and of 1024 for LFI (note that the LFI 70 GHz has been delivered also at Nside of 2048 to be directly comparable with HFI maps), in Galactic coordinates, and Nested ordering. The signal is given in units of Kcmb for 30-353 GHz, and of MJy/sr (for a constant $\nu F_\nu$ energy distribution ) for 545 and 857 GHz. Each sky map is packaged into a BINTABLE extension of a FITS file together with a hit-count map (or hit map, for short, giving the number of observation samples that are cumulated in a pixel, all detectors combined) and a variance map (determined from the half-ring maps), and additional information is given in the FITS file header. The structure of the FITS file is given in the FITS file structure section below.
Types of maps[edit]
- Full channel maps
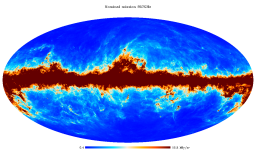
- Full channel maps are built using all the valid detectors of a frequency channel and cover the nominal mission. For HFI, the 143-8 and 545-3 bolometers are rejected entirely as they are seriously affected by RTS noise. The maps are displayed in the figures below. The range is the same from 30 - 143 GHz in order to show the CMB at the same level. At higher frequencies the range is increased in order to keep the Galactic Plane from invading the whole sky.
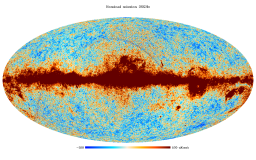
Nominal mission, 30 GHz
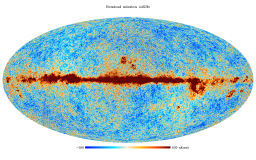
Nominal mission, 44 GHz
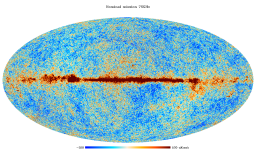
Nominal mission, 70 GHz
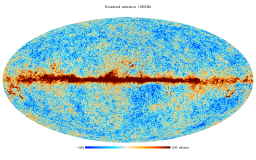
Nominal mission, 100 GHz
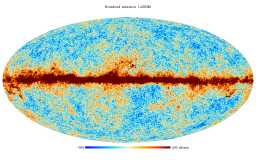
Nominal mission, 143 GHz
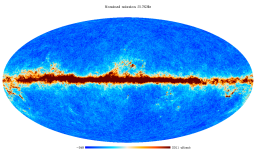
Nominal mission, 217 GHz
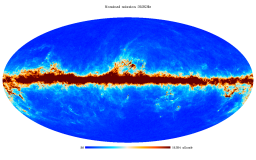
Nominal mission, 353 GHz
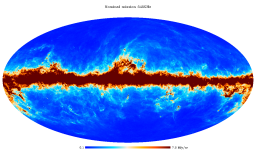
Nominal mission, 545 GHz
Nominal mission, 857 GHz


- Single survey maps
- Single survey maps are built using all valid detectors of a frequency channel; they cover separately the different sky surveys. The surveys are defined as the times over which the satellite spin axis rotates but 180 degrees, which, due to the position of the detectors in the focal plane does not cover the full sky, but a fraction between ~80 and 90% depending on detector position.
- Detector set or detector pairs maps
- These are maps built from a subset of the detectors in a frequency channel, typically our of two PSB pairs (i.e., four poloarisation-sensitive bolometers with different orientation on the sky), for HFI in order to extract a single temperature map. While none of these maps are part of the first Planck data release, the concept of detset is used, and thus it is worth mentioning it here. In particular, information by detector set is available at the sky power spectrum level and in the RIMO.
- Half-ring maps
- Half-ring maps are built using only the first or the second half of the stable pointing period data. There are thus two half-ring maps per frequency channel named ringhalf_1 and ringhalf_2 respectively. These maps are built for characterization purposes in order to perform null tests. In particular, the difference between the two half-ring maps at a given frequency give a good estimate of the high frequency noise in the data (albeit biased low by ~0.5% for the HFI channels due to specifics of the TOI processing).
- Masks
- Masks are provided of the Galactic Plane and of the point sources. For the Galactic Plane, eight masks are given covering different fractions of the sky, and for the points sources two masks are given, at the 5 and 10 sigma level, for each Planck HFI frequency channel. These are generic masks, specific masks applicable to other products are delivered with the products themselves.
Caveats and known issues[edit]
The primary limitation of the HFI maps are
- the absence of correction of the ADC non-linearities,
- the far-side lobe contribution is not accounted for in the processing and in the calibration,
- the dipole removal is based on the non-relativistic approximation which leaves a weak quadrupole component in the map.
And thus the overall calibration accuracy is at the 0.2% level in 100-217 GHz channels
The LFI 70 GHz maps at Nside=2048 should be considered as additional product, the default are the LFI maps at Nside=1024. No effective beam at Nside=2048 is provided, only at Nside=1024, for this reason the use of the effective beam with maps at Nside 2048 is discouraged.
Map zero-level[edit]
For the 100 to 857 GHz maps, the zero levels are set to their optimal levels for Galactic and CIB studies. A procedure for adjusting them to astrophysical values is given in the HFI Calibration paper Planck-2013-VIII[1].
For the 30, 44 and 70 GHz, maps are corrected for zero level monopole by applying an offset correction, see LFI Calibration paper Planck-2013-V[2] section 3.4 "Setting the zero levels in the maps". Note that the offset applied is indicated in the header as a comment keyword.
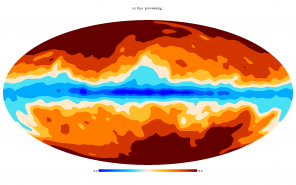
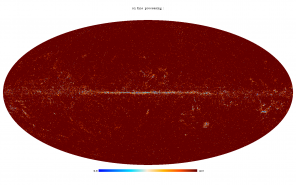
The Zodiacal light and the Far-Side Lobes[edit]
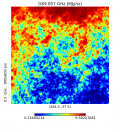
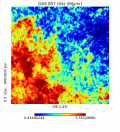
The figures below show the modeled Zodiacal light and Far Side Lobes projected onto the maps; they are simply the difference between the main product and the ZodiCorrected maps for the nominal mission. The units are given in the figures. The heat color table has been used in place of the standard Planck for clarity reasons.
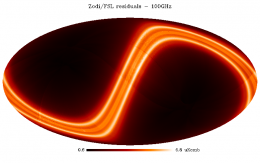
zodi/FSL rediduals - 100 GHz
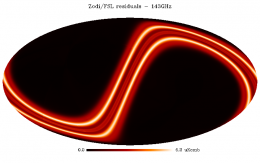
zodi/FSL rediduals - 143 GHz
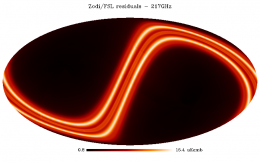
zodi/FSL rediduals - 217 GHz
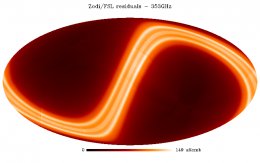
zodi/FSL rediduals - 353 GHz
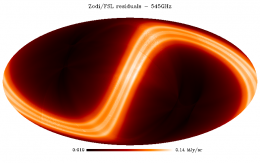
zodi/FSL rediduals - 545 GHz
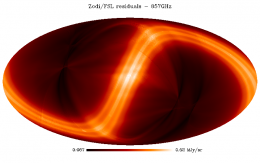
zodi/FSL rediduals - 857 GHz


The effects of the FSLs are seen most clearly at the highest frequencies, as structures roughly symmetric about the center of the image, which corresponds to the location of the Galactic Centre, which is in turn the source of most of the radiation that is scattered into the FSLs.
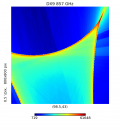
Artifacts near caustics of the scanning strategy[edit]
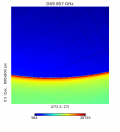
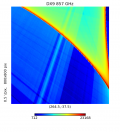
The scanning strategy is such that regions around the Ecliptic poles are surveyed very deeply and compared to the average, and the transition from the nominal depth to the high depth, as shows on hit-count maps is very rapid, namely a few pixels, for a contrast of ~30. These transitions, or caustics in the maps, occur at different positions on the sky for different detectors, as the positions depend on their location in the focal plane of the instrument. As a result, when data from different detectors are combined to build a full channel map, the the weights of different detectors in the mix changes rapidly across the caustic, and given the remaining errors in the relative calibration of the detectors, a visible effect can be introduced in the maps, especially when the SNR is very high, i.e. at the highest frequencies and near bright regions like the Galactic Plane. Some examples are shown below.
857 GHz intensity map around (272.5, -27)
857 GHz intensity map around (264.5, -37.5)
857 GHz intensity map around (98.5, 43)
857 GHz hit count map around (272.5, -27)
857 GHz hit count map around (264.5, -37.5)
857 GHz hit count map around (98.5, 43)


Production process[edit]
Sky maps are produced by combining appropriately the data of all working detectors in a frequency channel over some period of the mission. They give the best estimate of the signal from the sky (unpolarised) after removal, as far as possible, of known systematic effects and of the dipole signals induced by the motion of the solar system in the CMB and of the Planck satellite in the solar system. In particular, they include the Zodiacal light emission (Zodi for short) and also the scattering from the far-side lobes of the beams (FSL). More on this below.
HFI processing[edit]
The inputs to the mapmaking are TOIs of signal that have been cleaned (as far as possible) of instrumental effects and calibrated in absorbed watts. While the processing involved is described in detail in the TOI processing section, we give a very brief summary here for convenience. That pipeline performs the following operations:
- demodulation
- this is performed around a variable level which is determined from the valid input data (a validity flag from a previous version of the processing is used for this purpose), and the data are converted to engineering units (V) using known conversion coefficients.
- despiking
- using the demodulated data converted to V (by the transfer function) the glitches are identified and fitted with templates. A glitch flag is produced that identifies the strongest part of the glitches, and a timeline of glitch tails is produced from the template fits, and subtracted from the demodulated timeline from step 1. Finally, the flagged ranges are replaced with data from an average over the pointing period (TBC)
- dark template removal
- the two dark bolometers are demodulated and despiked as above; the resulting timelines are then smoothed and used as an indicator of the overall temperature variations of the bolometer plate. Where the variations are consistent with each other, they are combined and removed from the bolometer signal timelines using appropriate coupling coefficients. The few percent of the data where they are not consistent are flagged on the timelines.
- conversion to absorbed power
- the timeline is converted to watts of absorbed power using the bolometer function. This includes a non-linearity correction; removal of the 4K cooler lines: the electromagnetic interference of the 4K cooler with the bolometer readout wires induces some sharp lines in the signal power spectra at frequencies of the 4K cooler's fundamental and its multiples, folded by the signal modulations. Fourier coefficients of the relevant lines are determined on a per-ring basis, and then removed from the data. The quality of the removal depends on the bolometer.
- deconvolution by the time transfer function
- this is done to correct for the non-instantaneous time response of the bolometers. The function itself is modeled using 4 parameters which are adjusted primarily on the planet data and also from comparisons of the northward and southward scans of the Galactic Plane. It is then removed using Fourier techniques, which has the side-effect of increasing the noise at high frequencies.
- jump correction
- removes some (relatively rare: 0.3 jumps per bolometer per pointing period, on average) jumps in the signal baseline. The jumps are detected characterized on smoothed TOIs, and corrected by adding a constant to part of the signal timeline. The origin of the jumps is not known.
The results of this processing are a timeline of signal (in absorbed watts) and a valid data flag timeline for each of the 50 valid bolometers processed; these timelines contain the full sky signal, i.e., including the solar and orbital dipoles, the Zodiacal light, and contributions from the Far-Side lobes. The dipoles are necessary for the flux calibration and are removed at the mapmaking stage. The remaining two bolometers (143-8 and 535-3) show semi-random jumps in the signal level, typically jumping over 2-5 different pseudo-baseline levels, a behavior known as Random Telegraphic Signal, so that these are commonly called the RTS bolometers. Finally, ring-level statistics of different types (mean, median, rms, kurtosis, etc.) are determined on a per-ring basis for all timelines, and a selection based on these statistics is used to discard anomalous rings, which are recorded in a ring-level flag for each valid bolometer timeline (see the Discarded rings section).
Throughout this processing, bright planets (Mars, Jupiter, Saturn, Uranus) and bright asteroids are masked in the timeline in order to avoid ringing effects in the processing. Since they move on the sky, the portion of the sky masked during one survey is observed during one, and no hole is left in the final map. In parallel, the planet data are processed in a similar way, but with different parameters for the despiking step, and without the final jump correction step. These results are processed separately to determine the beam shapes and the focal plane geometry.
The pointing is determined starting from the AHF produced by MOC, which gives the direction and orientation of the LOS of a fiducial position in the focal plane at frequencies of 8Hz during stable pointing and 4 Hz during maneuvers (TBC for details, reference). This is interpolated to the times of data observation (ref to method), corrected for the wobble and other time-dependent offsets determined from the observed positions of a large number of sources around the sky, and finally converted to the LOS of each detector using the quaternions in the IMO (which are determined from observations of bright planets - see the Detector_pointing section).
The mapmaking and calibration process is described in detail in the Map-making section, where detailed references are found. In brief it consists of:
- binning the TOI data onto rings
- Healpix rings (HPRs) are used here, each ring containing the combined data of one pointing period.
- flux calibration
- at 100-353 GHz, the flux calibration factors are determined for each pointing period (or ring) from the solar-motion dipole, using the WMAP dipole as the reference, and after removal of the dipole signal induced by the motion of the Planck satellite in the solar system. This gain by ring is smoothed with a window of width 50 rings, which reveals an apparent variation of ~1-2% on a scale of 100s to 1000s of rings for the 100-217 GHz channels, and is applied. At 353GHz, where the solar motion dipole is weaker compared to the signal, no gain variation is detected (within the uncertainties), and a single fixed gain is applied to all rings. At 545 and 857 GHz the gain is determined from the observation of Uranus and Neptune (but not Jupiter which is too bright) and comparison to recent models made explicitly for this mission. A single gain is applied to all rings at these frequencies.
- destriping
- in order to remove low-frequency noise, an offset per ring is determined by minimizing the differences between HPRs at their crossings, and removed.
- projection onto the map
- the offset-corrected and flux-calibrated HPRs are projected onto Healpix maps, with the data of each bolometer weighted by a factor of 1/NET of that bolometer, and accounting for the slight different band transmission profiles of the bolometers in each band.
These maps provide the main mission products. A second, reduced, set of maps, cleaned of the Zodiacal emission of the FSL leakage is also produced for the nominal mission and the two single surveys, but not for the half-rings (since the contribution would be the same for the two halves of each ring). For this purpose, the the Zodiacal emission and the FSL contamination, which are not fixed on the sky, are modeled separately at HPR-level, and subtracted from the signal HPR before projecting them onto the maps.
Together with signal maps, hit count and variance maps are also produced. The hit maps give the (integer) number of valid TOI-level samples that contribute to the signal of each pixel. All valid samples are counted in the same way, i.e., there is no weighting factor applied. The variance maps project the white noise estimate, provided by the NETs, in the sky domain.
LFI processing[edit]
LFI maps were constructed with the Madam map-making code, version 3.7.4. The code is based on generalized destriping technique, where the correlated noise component is modeled as a sequence of constant offset, called baselines. A noise filter was used to constrain the baseline solution allowing the use of 1 second baselines.
Radiometers were combined according to the horn-uniform weighting scheme to minimize systematics. The used weights are listed in Map-making. The flagged samples were excluded from the analysis by setting their weights to $C_{w}^{-1}$ = 0. The galaxy region was masked out in the destriping phase, to reduce error arising from strong signal gradients. The polarization component was included in the analysis, although only the temperature maps are released.
A detailed description of the map-making procedure is given in Planck-2013-II[3] and in section Map-making.
Inputs[edit]
HFI inputs[edit]
- The cleaned TOIs of signal of each detector, together with their flags, produced by the TOI processing pipeline
- The TOIs of pointing (quaternions), described in Detector_pointing
- Bolometer-level characterization data, from the DPC's internal IMO (not distributed)
- Planck orbit data used to compute and remove the earth dipole
- WMAP solar dipole information used to calibrate the CMB channels
- Planet models used to calibrate the Galactic channels.
LFI inputs[edit]
The Madam map-maker takes as an input:
- The calibrated timelines (for details see TOI Processing)
- The detector pointings (for details see Detector pointing)
- The noise information in the form of three-parameter (white noise level ($\sigma$), slope, and knee frequency ($f_\mathrm{knee}$)) noise model (for details see RIMO)
Related products[edit]
Masks[edit]
Masks are provided of
- the point sources
- 15 masks are provided, three for the LFI (one mask for each frequency masking at the 4 level) and 12 for the HFI (two masks for each frequency at the 5 and 10 levels. For the HFI the masks can be used as they are, for the LFI they need to be downgraded to Nside=1024 except for the 70 GHz channel at Nside=2048 which does not need to be downgraded.
- the Galactic Plane
- 8 masks are provided giving 20, 40, 60, 70, 80, 90, 97, and 99% sky coverage in two different files, at Nside=2048. For the HFI they can be used as they are, for the LFI they need to be downgraded at Nside=1024 (note that if using the 70 GHZ at Nside=2048 no downgraded is needed)
The masks are binary, in GALACTIC coordinates, and NESTED ordering. The table below give the filenames.
| Frequency | LFI Point Source masks |
|---|---|
| 30GHz | LFI_MASK_030-ps_2048_R1.00.fits |
| 44GHz | LFI_MASK_044-ps_2048_R1.00.fits |
| 70GHz | LFI_MASK_070-ps_2048_R1.00.fits |
| HFI Point Source masks | |
| HFI_Mask_PointSrc_2048_R1.10.fits | |
| Galactic Plane masks | |
| HFI_Mask_GalPlane_2048_R1.10.fits | |
The masks are shows below in a single figure. While this is quite clear for the Galactic Plane masks, it is less so for the point source masks, but it does give a clear perspective on how the latter are distributed over the sky.
Galactic Plane masks
PointSource masks


File names[edit]
The FITS filenames are of the form {H|L}FI_SkyMap_fff_nnnn_R1.nn_{coverage}_{type}.fits, where fff are three digits to indicate the Planck frequency band, and nnnn is the Healpix Nside of the map, coverage indicates which part of the mission is covered, and the optional type indicates the subset of input data used. A full list of products, with links to them in the Archive, is given in the tables below.
For the benefit of users who are only looking for the frequency maps with no additional information, we also provide a file combining the 9 frequency maps as separate columns in a single extension. The 9 columns in this file contain the intensity maps ONLY and no other information (hit maps and variance maps) is provided.
| Frequency | Full channel maps |
|---|---|
| 30GHz | LFI_SkyMap_030_1024_R1.10_nominal.fits |
| 44GHz | LFI_SkyMap_044_1024_R1.10_nominal.fits |
| 70GHz | LFI_SkyMap_070_1024_R1.10_nominal.fits |
| 70GHz | LFI_SkyMap_070_2048_R1.10_nominal.fits |
| 100GHz | HFI_SkyMap_100_2048_R1.10_nominal.fits |
| 143GHz | HFI_SkyMap_143_2048_R1.10_nominal.fits |
| 217GHz | HFI_SkyMap_217_2048_R1.10_nominal.fits |
| 353GHz | HFI_SkyMap_353_2048_R1.10_nominal.fits |
| 545GHz | HFI_SkyMap_545_2048_R1.10_nominal.fits |
| 857GHz | HFI_SkyMap_857_2048_R1.10_nominal.fits |
| Frequency | Full channel, Zodi-corrected maps |
| 100GHz | HFI_SkyMap_100_2048_R1.10_nominal_ZodiCorrected.fits |
| 143GHz | HFI_SkyMap_143_2048_R1.10_nominal_ZodiCorrected.fits |
| 217GHz | HFI_SkyMap_217_2048_R1.10_nominal_ZodiCorrected.fits |
| 353GHz | HFI_SkyMap_353_2048_R1.10_nominal_ZodiCorrected.fits |
| 545GHz | HFI_SkyMap_545_2048_R1.10_nominal_ZodiCorrected.fits |
| 857GHz | HFI_SkyMap_857_2048_R1.10_nominal_ZodiCorrected.fits |
| Frequency | Combined frequency maps |
| All | COM_MapSet_I-allFreqs_R1.10_nominal.fits |
FITS file structure[edit]

The FITS files for the sky maps contain a minimal primary header with no data, and a BINTABLE extension (EXTENSION 1, EXTNAME = FREQ-MAP) containing the data. The structure is shows schematically in the figure at right.
The FREQ-MAP extension contains is a 3-column table that contain the signal, hit-count and variance maps, all in Healpix format, in columns 1, 2, and 3, respectively. The number of rows is 50331648 for HFI and LFI 70 GHz at Nside=2048 and 12582912 for LFI maps at Nside=1024 (N.B: Npix = 12 Nside^2). The three columns are I_STOKES for the intensity (or temperature) signal, HIT for the hit-count and II_COV for the variance. The exact order of the columns in the figure is indicative only, and the details can be found in the keywords.
Keywords indicate the coordinate system (GALACTIC), the Healpix ordering scheme (NESTED), the units (K_cmb or MJy/sr) of each column, and of course the frequency channel (FREQ). The COMMENT fields give a one-line summary of the product, and some other information useful for traceability within the DPCs. The original filename is also given in the FILENAME keyword as are the datasum and the md5 checksum for the extension. The BAD_DATA keyword gives the value used by Healpix to indicate pixels for which no signal is present (these will also have a hit-count value of 0). The COMMENT fields give further information including some traceability data for the DPC's. The main parameters are summarised below:
| 1. EXTNAME = 'FREQ-MAP' : Data columns | |||
|---|---|---|---|
| Column Name | Data Type | Units | Description |
| I_STOKES | Real*4 | K_cmb or MJy/sr | The signal map |
| HITS | Int*4 | none | The hit-count map |
| II_COV | Real*4 | K_cmb2 or (MJy/sr)2 | The variance map |
| Keyword | Data Type | Value | Description |
| PIXTYPE | string | HEALPIX | |
| COORDSYS | string | GALACTIC | Coordinate system |
| ORDERING | string | NESTED | Healpix ordering |
| NSIDE | Int | 1024 or 2048 | Healpix Nside |
| FIRSTPIX | Int*4 | 0 | First pixel number |
| LASTPIX | Int*4 | 12582911 or 50331647 | Last pixel number |
| FREQ | string | nnn | The frequency channel |
The same structure applies to all SkyMap products, independent of whether they are full channel, survey of half-ring. The distinction between the types of maps is present in the FITS filename (and in the traceability comment fields).
References[edit]
- ↑ Planck 2013 results: HFI calibration and Map-making, Planck Collaboration 2013 VIII, A&A, in press, (2014).
- ↑ Planck 2013 results: LFI Calibration, Planck Collaboration 2013 V, A&A, in press, (2014).
- ↑ Planck 2013 results: The Low Frequency Instrument data processing, Planck Collaboration 2013 II, A&A, in press, (2014).
Cosmic Microwave background
(Planck) High Frequency Instrument
(Planck) Low Frequency Instrument
Flexible Image Transfer Specification
random telegraphic signal
analog to digital converter
[LFI meaning]: absolute calibration refers to the 0th order calibration for each channel, 1 single number, while the relative calibration refers to the component of the calibration that varies pointing period by pointing period.
To be confirmed
sudden change of the baseline level inside a ring
Attitude History File
[ESA's] Mission Operation Center [Darmstadt, Germany]
Line Of Sight
Noise Equivalent Temperature
Data Processing Center