HFI spectral response data processing
HFI spectral response pre-flight spectral characterization data processing and Fourier transformation[edit]
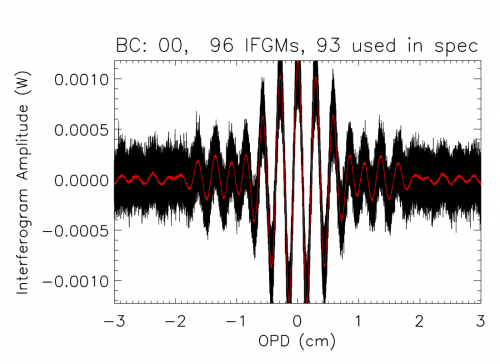
The bolometer signal is stored within the initial database in several formats: raw ADU, signal voltage, resistance, current, temperature, total power, electrical power, and radiant power, all of which may be exported as a function of sample time. A bolometer model was applied to the raw data to produce interferograms in units of absorbed optical power. This both reduced the in-band effects of detector nonlinearities, and allowed another comparison of optical efficiency to complement the EFF tests. The location of Zero Optical Path Difference (ZPD) is estimated for each interferogram, and the interferogram boundaries are determined as the mid-points between subsequent interferograms, less a small number of buffer points (10) to ensure that the extracted interferograms include regions associated with the FTS stage travel having constant velocity while excluding the acceleration regions. Visual verification of the extracted interferograms is performed prior to subsequent processing and averaging to ensure that each ZPD was identified correctly, and to remove any low-quality interferograms. The overlap of the extracted interferograms is also verified visually. Once interferograms have been extracted from each data set, the overall spectral resolution is evaluated and an evenly sampled Optical Path Difference (OPD) grid onto which each interferogram in the combined data is then interpolated is generated. This ensures that each individual interferogram is sampled at ZPD and that each spectrum has identical frequency sampling and can thus be averaged together. An example of a combined interferogram data set is illustrated in the figure below where the central portions of the recorded interferograms are shown.
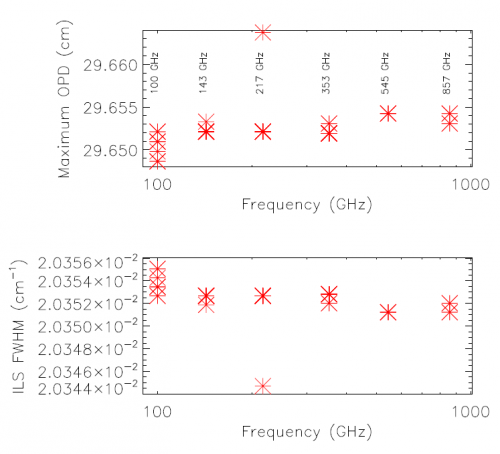
The Maximum Path Difference (MPD) value for each detector, and corresponding spectral resolution, is shown in the figure below
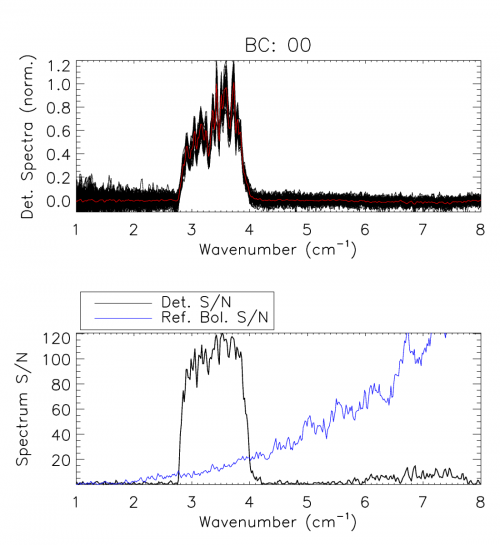
In preparation for Fourier transformation, a low-order polynomial baseline removal is performed on the individual interferograms. Consequently, no information can be recovered from the spectrum below , but this is of no concern as this region of the spectrum is replaced by a waveguide fit in the final data product (see HFI detector feedhorn model parameters section). An average interferogram is determined and used to identify glitches for removal from the interferogram data. Following glitch removal, individual interferograms undergo standard Fourier data processing. The modified Norton-Beer 1.5 apodization function ( [ref.] ) has been selected to be used for the final spectral transmission profile data set as it represents a good compromise between the desired ILS sidelobe reduction and improved S/N with marginal reduction in spectral resolution. Data averaging is then performed in the spectral domain. The uncertainty for every spectral data point is determined statistically through the standard deviation at a given frequency. A check for poor quality spectra is performed by comparing the overall standard deviation including and excluding any given spectrum. An example of the individual spectra and uncertainty for bc00 is shown in the figure below, along with the corresponding S/N of the reference bolometer spectrum. An estimate of the spectral S/N for each detector is obtained using the average spectrum and its statistical uncertainty, averaged across the in-band region of the spectrum.
The averaged spectra are then normalized and divided by a (normalized) reference bolometer spectrum (see Reference bolometer spectra and HFI reference bolometer sections) to obtain the HFI detector relative spectral response.
| Band (GHz) | bc | # Ifgm. | # Spec. | MPD (cm) | ILS (cm) | avg. S/N |
| 100 | 00 | 96 | 93 | 29.648639 | 0.020355066 | 104.70555 |
| 100 | 01 | 96 | 95 | 29.648639 | 0.020355066 | 203.34226 |
| 100 | 20 | 96 | 96 | 29.649801 | 0.020354268 | 271.38262 |
| 100 | 21 | 95 | 94 | 29.650962 | 0.020353471 | 264.65385 |
| 100 | 40 | 96 | 94 | 29.652124 | 0.020352674 | 432.40921 |
| 100 | 41 | 96 | 96 | 29.652124 | 0.020352674 | 962.98064 |
| 100 | 80 | 95 | 95 | 29.650962 | 0.020353471 | 262.71036 |
| 100 | 81 | 96 | 96 | 29.650962 | 0.020353471 | 227.35782 |
| 143 | 02 | 96 | 95 | 29.652124 | 0.020352674 | 434.93136 |
| 143 | 03 | 96 | 96 | 29.652124 | 0.020352674 | 458.86741 |
| 143 | 10 | 95 | 95 | 29.652124 | 0.020352674 | 565.21311 |
| 143 | 30 | 92 | 92 | 29.653286 | 0.020351876 | 424.53824 |
| 143 | 31 | 92 | 92 | 29.652124 | 0.020352674 | 447.50343 |
| 143 | 42 | 92 | 92 | 29.652124 | 0.020352674 | 536.23423 |
| 143 | 50 | 96 | 96 | 29.652124 | 0.020352674 | 441.68983 |
| 143 | 51 | 96 | 96 | 29.652124 | 0.020352674 | 476.22684 |
| 143 | 60 | 96 | 96 | 29.652124 | 0.020352674 | 517.43269 |
| 143 | 70 | 95 | 94 | 29.652124 | 0.020352674 | 326.06542 |
| 143 | 82 | 96 | 96 | 29.652124 | 0.020352674 | 454.23293 |
| 143 | 83 | 96 | 96 | 29.652124 | 0.020352674 | 439.50612 |
| 217 | 04 | 96 | 96 | 29.652124 | 0.020352674 | 625.92713 |
| 217 | 11 | 96 | 96 | 29.652124 | 0.020352674 | 580.32904 |
| 217 | 12 | 67 | 67 | 29.663741 | 0.020344703 | 549.24264 |
| 217 | 22 | 96 | 96 | 29.652124 | 0.020352674 | 550.65242 |
| 217 | 43 | 95 | 95 | 29.652124 | 0.020352674 | 616.57750 |
| 217 | 44 | 96 | 96 | 29.652124 | 0.020352674 | 543.78288 |
| 217 | 52 | 95 | 94 | 29.652124 | 0.020352674 | 684.91039 |
| 217 | 61 | 92 | 92 | 29.652124 | 0.020352674 | 594.70296 |
| 217 | 62 | 95 | 95 | 29.652124 | 0.020352674 | 579.69385 |
| 217 | 71 | 96 | 96 | 29.652124 | 0.020352674 | 631.30065 |
| 217 | 72 | 96 | 96 | 29.652124 | 0.020352674 | 687.10844 |
| 217 | 84 | 92 | 92 | 29.652124 | 0.020352674 | 636.36790 |
| 353 | 05 | 55 | 55 | 29.651916 | 0.020352816 | 354.15815 |
| 353 | 13 | 57 | 57 | 29.651916 | 0.020352816 | 319.09858 |
| 353 | 23 | 55 | 55 | 29.651916 | 0.020352816 | 218.05772 |
| 353 | 24 | 64 | 64 | 29.651916 | 0.020352816 | 236.44464 |
| 353 | 32 | 56 | 56 | 29.651916 | 0.020352816 | 238.40018 |
| 353 | 33 | 55 | 55 | 29.651916 | 0.020352816 | 219.60443 |
| 353 | 45 | 64 | 64 | 29.653078 | 0.020352019 | 246.97889 |
| 353 | 53 | 57 | 57 | 29.651916 | 0.020352816 | 225.27621 |
| 353 | 54 | 57 | 57 | 29.651916 | 0.020352816 | 228.47058 |
| 353 | 63 | 57 | 56 | 29.651916 | 0.020352816 | 140.16991 |
| 353 | 64 | 55 | 55 | 29.651916 | 0.020352816 | 158.85037 |
| 353 | 85 | 57 | 57 | 29.653078 | 0.020352019 | 246.18460 |
| 545 | 14 | 63 | 63 | 29.654240 | 0.020351221 | 448.67624 |
| 545 | 34 | 64 | 64 | 29.654240 | 0.020351221 | 481.87111 |
| 545 | 55 | 57 | 57 | 29.654240 | 0.020351221 | 328.07835 |
| 545 | 73 | 57 | 57 | 29.654240 | 0.020351221 | 447.49901 |
| 857 | 25 | 64 | 64 | 29.653078 | 0.020352019 | 501.25106 |
| 857 | 35 | 64 | 64 | 29.654240 | 0.020351221 | 567.55125 |
| 857 | 65 | 42 | 42 | 29.653078 | 0.020352019 | 482.41906 |
| 857 | 74 | 64 | 64 | 29.654240 | 0.020351221 | 491.89133 |
(Planck) High Frequency Instrument
Instrument Line Shape
Full-Width-at-Half-Maximum


