Difference between revisions of "ZodiFreqFits"
| Line 5: | Line 5: | ||
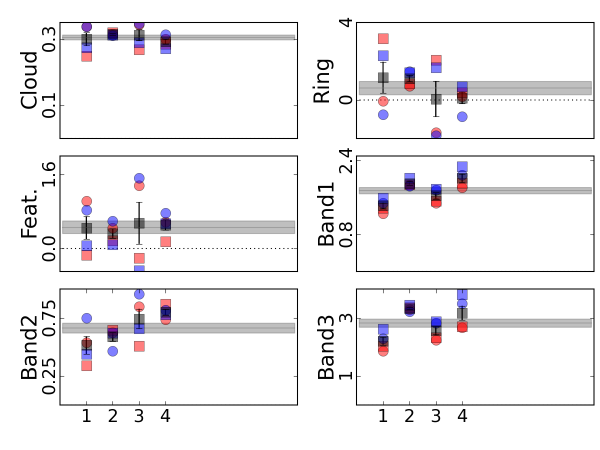
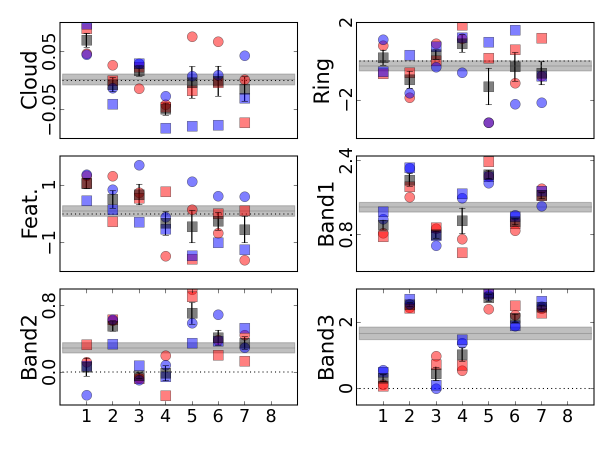
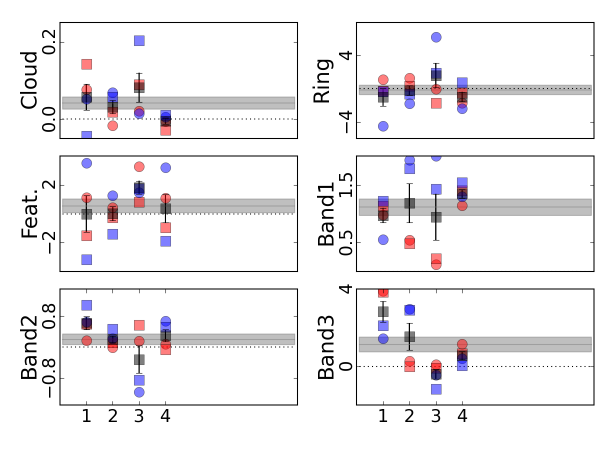
Results of fits at 857 GHz. Data from the first year of observations are shown in white, while data from the second year of observations are shown in gray. Surveys 1 and 3 are shown with circles, while surveys 2 and 4 are shown with squares. The average of the points shown, and the uncertainties are representated with the horizontal gray band, and where appropriate, a dotted line is used to mark the `zero' level. | Results of fits at 857 GHz. Data from the first year of observations are shown in white, while data from the second year of observations are shown in gray. Surveys 1 and 3 are shown with circles, while surveys 2 and 4 are shown with squares. The average of the points shown, and the uncertainties are representated with the horizontal gray band, and where appropriate, a dotted line is used to mark the `zero' level. | ||
| + | For 545 GHz: | ||
[[File:111110111111111__545__10-0.png|600px|545 GHz Zodi Fit Results]] | [[File:111110111111111__545__10-0.png|600px|545 GHz Zodi Fit Results]] | ||
| + | |||
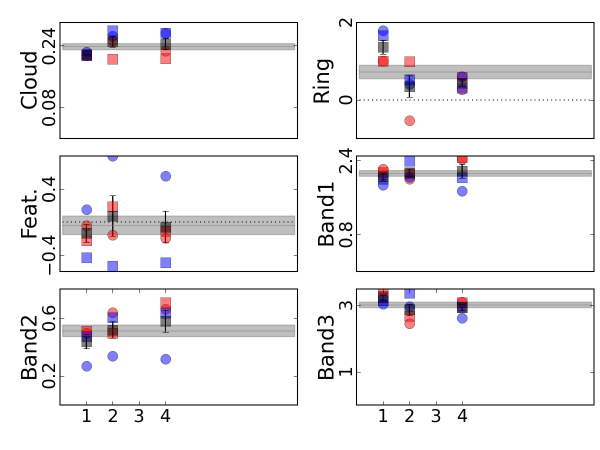
| + | For 353 GHz: | ||
[[File:111110111111111__353__10-0.png|600px|353 GHz Zodi Fit Results]] | [[File:111110111111111__353__10-0.png|600px|353 GHz Zodi Fit Results]] | ||
| + | |||
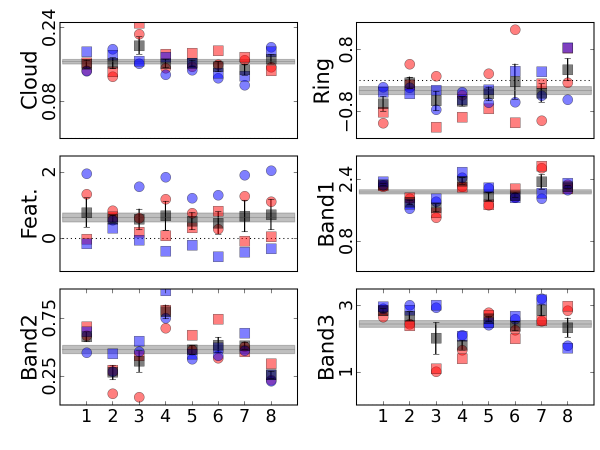
| + | For 217 GHz: | ||
[[File:111110111111111__217__10-0.png|600px|217 GHz Zodi Fit Results]] | [[File:111110111111111__217__10-0.png|600px|217 GHz Zodi Fit Results]] | ||
| + | |||
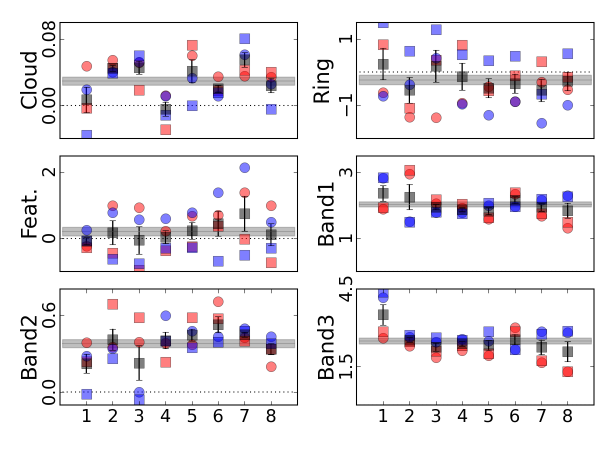
| + | For 143 GHz: | ||
[[File:111110111111111__143__10-0.png|600px|143 GHz Zodi Fit Results]] | [[File:111110111111111__143__10-0.png|600px|143 GHz Zodi Fit Results]] | ||
| + | |||
| + | For 100 GHz: | ||
[[File:111110111111111__100__10-0.png|600px|100 GHz Zodi Fit Results]] | [[File:111110111111111__100__10-0.png|600px|100 GHz Zodi Fit Results]] | ||
Latest revision as of 16:13, 20 February 2013
Fits to the COBE Zodiacal Emission model at each Planck/HFI frequency are encapsulated in the files below.
Results of fits at 857 GHz. Data from the first year of observations are shown in white, while data from the second year of observations are shown in gray. Surveys 1 and 3 are shown with circles, while surveys 2 and 4 are shown with squares. The average of the points shown, and the uncertainties are representated with the horizontal gray band, and where appropriate, a dotted line is used to mark the `zero' level.
(Planck) High Frequency Instrument
