Difference between revisions of "HFI cold optics"
(→Reference Bolometer Spectra) |
m (→Spectral response conclusions and conformity with requirements) |
||
| (115 intermediate revisions by 8 users not shown) | |||
| Line 1: | Line 1: | ||
| − | + | == Horns, lenses and filters== | |
| + | The cold optics are described in {{PlanckPapers|ade2010}}. | ||
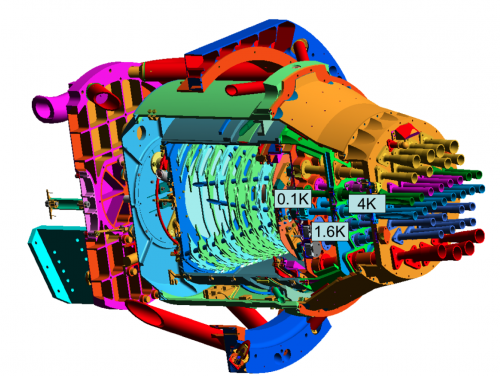
| − | + | [[Image:HFI_2_4_1_JML_ColdOptics.png|thumb|500px|center|Mechanical and thermal structure of the HFI focal plane unit.]] | |
| − | |||
| − | [[Image:HFI_2_4_1_JML_ColdOptics.png|thumb|500px|center|Mechanical and thermal structure of the HFI | ||
| − | + | In order to meet straylight, beam shape and filtering requirements, a design using feedhorn-coupled detectors was chosen, with a triple horn configuration (see figure below). | |
| − | In order to meet | + | A detailed description of the HFI optical design and beam performance is given in {{PlanckPapers|maffei2010}}. |
| − | A detailed description of the HFI optical design and beam | ||
| − | [[Image:HFI_2_4_1_JML_FeedHorns.png|thumb|500px|center|Optics of the HFI | + | [[Image:HFI_2_4_1_JML_FeedHorns.png|thumb|500px|center|Optics of the HFI focal plane unit. The back-to-back horn (front and back horns) couples the incoming radiation from the telescope to a detector horn which then couples the radiation to the bolometer. The filters determining the spectral bands are located between the two horn assemblies. A lens refocusses the radiation from the back horn to the detector.]] |
| − | === | + | ===Horn design and patterns=== |
| − | The spectral and geometrical properties of the horns have been characterized individually. | + | The cosmological channels (100 GHz, 143 GHz, 217 GHz, 353 GHz) have been designed to detect a single mode with one or two polarizations, for Polarization Sensitive Bolometers (PSBs) or Spider Web Bolometers (SWBs), respectively. The spectral and geometrical properties of the horns have been characterized individually. A typical example for a single-moded horn is given in the figure below. |
| − | |||
| − | |||
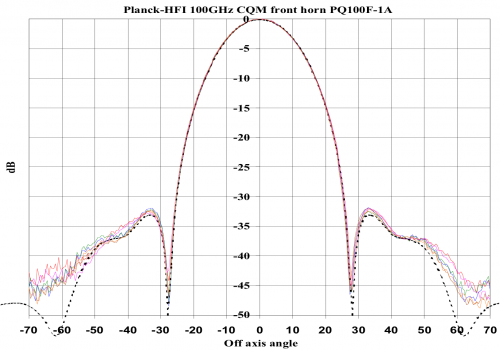
| − | + | [[Image:HFI_2_4_1_JML_beam.png|thumb|500px|center|Typical measurement/theory comparison for the co-pol beam pattern of the back-to-back horns at 100 GHz. Dots are the model and colours show measurements (with off-axis angle in degrees). Noise limits the accuracy below -35 dB.]] | |
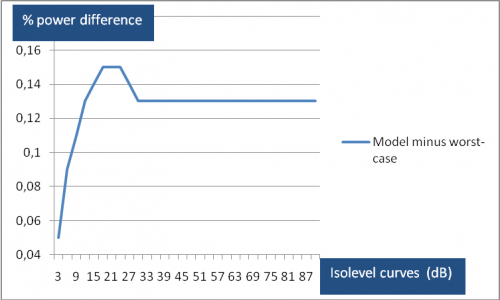
| − | As an example, in | + | The beam fits are excellent down to very low levels, which validates, at least for single-moded horns, the philosophy that prevailed for their development: modelling and optimizing the horns before implementation and then validating the model with a complete measurement of the beam intensity patterns. For the single-moded horns, a method has been developed to use the measured intensities, together with the phase information from modeling to derive “worst-case” horn beam patterns that can be used in GRASP simulations of the telescope beams (phase information is mandatory). Worst-case beam patterns have been computed for all single-moded HFI horn types in order to estimate an upper limit of the spillover. As an example, in the figure below, we show the difference in encircled power at isolevel intervals for the HFI 143_1a channel main beam, using both the model and worst-case patterns. |
| − | [[Image: | + | [[Image:HFI_2_4_1_JML_PowerDiff.png|thumb|500px|center|Difference from peak value of the power encircled within 3 dB curves. The main beam encloses at least 99.5 % (model) and 99.4% (worst-case) of the power.]] |
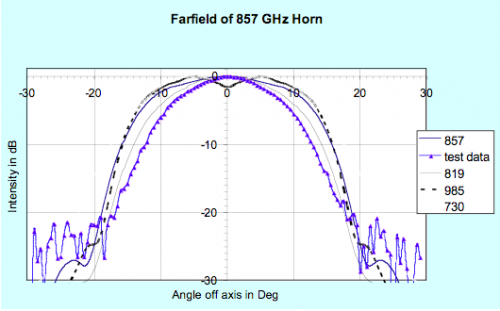
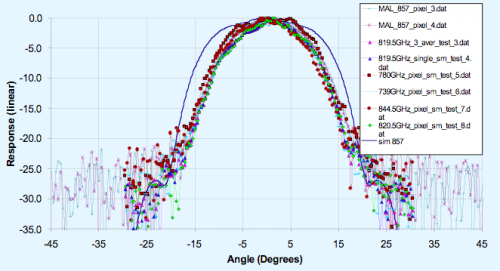
| − | + | In the high frequency 545 GHz and 857 GHz Planck channels both the back-to-back (BTB) horns and the detector horn have "overmoded" waveguide filters {{BibCite|Maffei2000}}. The far-field patterns of the horns (which illuminate the Planck mirrors) have been simulated, and are shown in the two figures below for a few spot frequencies across the 857 GHz band. Note that the edge taper is approx -30 dB at 25°, as required at the centre of the band. Superimposed is the broadband measurement, which clearly looks narrower than the majority of the spot frequency measurements and requires explanation. The measured far-field beam patterns across the band are narrower than the predicted far-field beams right across the band. The simulated beams are too wide, suggesting missing higher order modes, either due to attenuation between the cavity and the BTB, or arising from the experimental setup. | |
| − | + | [[Image:HFI_2_4_1_JML_FarField.png|thumb|center|500px|Model and measurement comparison for the far-field pattern of the 857 GHz Horn. The model is at spot frequencies, superimposed on the broadband test data.]] | |
| − | |||
| − | + | [[Image:HFI_2_4_1_JML_FarField2.png|thumb|500px|center|Model and measurement comparison for the far-field pattern of the 857 GHz Horn. The measurements are for broadband and spot frequencies with the BTB horn both outside and inside the test dewar window (the inside case being more representative of the true Planck channel).]] | |
| − | |||
| − | |||
| − | |||
| − | |||
| − | |||
| − | |||
| − | |||
| − | |||
| − | |||
| − | |||
| − | [[Image:HFI_2_4_1_JML_FarField2.png|thumb|500px|center|Model | ||
<div style="clear: both"></div> | <div style="clear: both"></div> | ||
== Spectral response== | == Spectral response== | ||
| − | |||
| − | |||
| − | The main goal of the spectral transmission tests of the HFI instrument is to measure the spectral response of all HFI detectors to a known source of EM radiation | + | The measurement of the spectral response of HFI is fully described in {{PlanckPapers|planck2013-p03d}}. The experimental setup, data collection, and related data processing are described. The official version of the HFI detector spectral transmission profiles is available within the HFI instrument model and [[the RIMO]] files in the [[Appendix#PLA quick start guide|Planck Legacy archive]]. These data are comprised of broadband Fourier transform spectrometer (FTS) measurements conducted with the HFI focal plane assembly in a ground-based test cryostat, and include a waveguide model for the low frequency spectral region, and component-level filter spectra for the remaining out-of-band spectral regions. Specific attention is given to in-band and near-band spectral regions surrounding CO rotational transitions, in order to support the CO extraction component separation effort {{PlanckPapers|planck2013-p03a}}{{PlanckPapers|planck2013-p06}}. The spectral transmission profiles are evaluated with parameters such as cut-on, cut-off, centre frequency, effective frequency (including spectral index), and band-width, all provided in this analysis. Further evaluation yields band-averaged spectra and unit conversion / colour correction coefficients {{PlanckPapers|planck2013-p03d}}, as well as software routines to generate additional unit conversion and colour correction coefficients, i.e., the unit conversion and colour correction ([[Unit conversion and Color correction|UCCC]]) routines. |
| + | |||
| + | The main goal of the spectral transmission tests of the HFI instrument is to measure individually the spectral response of all HFI detectors to a known source of EM radiation. This was determined by measuring the interferometric output of all detection channels for radiation propagated through a continuously scanned polarizing FTS. The required accuracy to which the spectral transmission is to be recovered is 1%. It is important to note that the absolute spectral calibration cannot be achieved solely from the analysis of the FTS data, because of uncertainties in the coupling efficiency of the FTS source through the FTS, input optics, and integrating sphere. The relative FTS measurements must be combined with the optical efficiency tests, which used internal blackbody sources (see section [[HFI optical efficiency]]). A reference bolometer located in an intermediate integrating sphere (accepting 2π sr of incident radiation) within the FTS test setup was used to obtain a ratio with the HFI detector spectra against to determine the throughput-normalized relative transmission spectra for each HFI detector. Data were collected over a series of pre-flight test campaigns, and analysed using standard Fourier data processing techniques. | ||
=== Additional experiments === | === Additional experiments === | ||
| − | + | Two significant additional tests were used in the derivation of the HFI detector spectral transmission profiles beyond the scope of the integrated HFI FTS measurements. Additional filter measurements were recorded at component level during filter stack production. These measurements were used to extend the integrated HFI FTS spectral measurements beyond the HFI spectral passband. The other experiments, herein the EFF tests, were used to obtain optical efficiency parameters for each detector, and thus an estimate of the absolute spectral transmission. These parameters, when combined with the respective normalized spectral transmission profiles, provide an estimate of the absolute spectral transmission. The EFF tests are discussed in greater detail in {{BibCite|Catalano2008Thesis}}. The filter measurements and the optical efficiency experiments are described below. | |
| + | <div id="sec:filter"></div> | ||
==== Filter measurements ==== | ==== Filter measurements ==== | ||
| − | |||
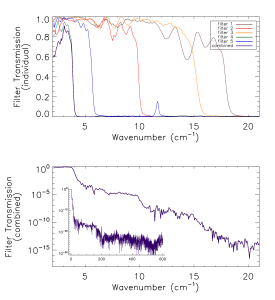
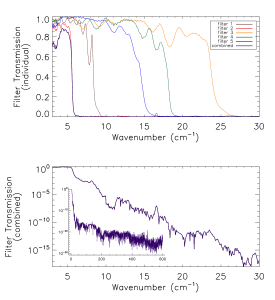
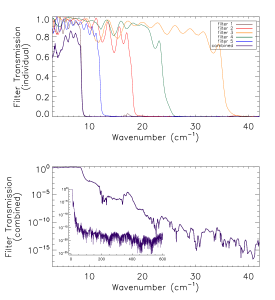
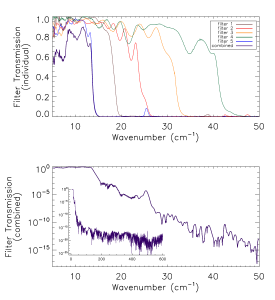
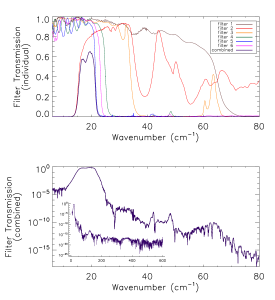
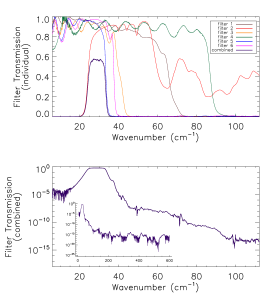
| − | Prior to the | + | Prior to the integrated HFI measurements with the integrated HFI detectors and filter stacks, FTS measurements were conducted of the individual filters comprising the filter stacks for each band. As discussed in [[#Out-of-band spectral transmission content|this section]], the independent measure of the filter stack transmission is used for a portion of the HFI detector spectral transmission for regions of the spectrum where it is deemed to be of better quality than the integrated HFI FTS measurements (i.e., for frequencies outside of the band edge filter cut-off(s)). The filter stacks for each of the frequency bands are comprised of five filters. There is an additional low frequency cut-on filter for the 545 and 857 GHz bands, because the waveguide cut-on is too low for these multi-moded channels. The figures below show the individual filter transmission measurements, as well as the combined filter stack product. |
| − | <gallery | + | <center> |
| − | File:HFI_FilterPlots_100GHz.png| | + | <gallery widths="300px" heights="300px" perrow="3"> |
| − | File:HFI_FilterPlots_143GHz.png| | + | File:HFI_FilterPlots_100GHz.png|100 GHz |
| − | File:HFI_FilterPlots_217GHz.png| | + | File:HFI_FilterPlots_143GHz.png|143 GHz |
| − | File:HFI_FilterPlots_353GHz.png| | + | File:HFI_FilterPlots_217GHz.png|217 GHz |
| − | File:HFI_FilterPlots_545GHz.png| | + | File:HFI_FilterPlots_353GHz.png|353 GHz |
| − | File:HFI_FilterPlots_857GHz.png| | + | File:HFI_FilterPlots_545GHz.png|545 GHz |
| + | File:HFI_FilterPlots_857GHz.png|857 GHz | ||
</gallery> | </gallery> | ||
| + | <small>Combined (bottom) and individual (top) filter transmission measurements for the five filters within the HFI band filter stacks (six for 545 and 857 GHz).</small> | ||
| + | </center> | ||
| − | The uncertainty on the combined filter transmission measurement is determined as follows. Let <math>f_i(\sigma)</math> represent the individual filter transmission. The standard deviation of all values of <math>f_i(\sigma)</math> below a threshold of <math>0.001</math> is used as an approximate uncertainty for each individual filter measurement, i.e. <math>\varsigma_{i}</math>. The individual uncertainty estimates are combined to provide an estimate of the combined filter transmission spectral uncertainty through standard error propagation. For the combined filter transmission represented as <math>F(\sigma)</math>, the associated uncertainty estimate is given as | + | The uncertainty on the combined filter transmission measurement is determined as follows. Let <math>f_i(\sigma)</math> represent the individual filter transmission. The standard deviation of all values of <math>f_i(\sigma)</math> below a threshold of <math>0.001</math> is used as an approximate uncertainty for each individual filter measurement, i.e., <math>\varsigma_{i}</math>. The individual uncertainty estimates are combined to provide an estimate of the combined filter transmission spectral uncertainty through standard error propagation. For the combined filter transmission, represented as <math>F(\sigma)</math>, the associated uncertainty estimate is given as |
<math>\label{eq:Ferror} | <math>\label{eq:Ferror} | ||
\varsigma_F(\sigma) = \displaystyle\sqrt{[F(\sigma)]^2\Sigma_i [(\frac{\varsigma_i}{f_i(\sigma)})^2] } ~.</math> | \varsigma_F(\sigma) = \displaystyle\sqrt{[F(\sigma)]^2\Sigma_i [(\frac{\varsigma_i}{f_i(\sigma)})^2] } ~.</math> | ||
| − | As described below, the composite filter spectra illustrated above form part of the official HFI detector spectral response, specifically for a portion of the out-of-band spectral region. The band- | + | As described below, the composite filter spectra illustrated above form part of the official HFI detector spectral response, specifically for a portion of the out-of-band spectral region. The band-averaged spectra, containing these data as a constituent, is provided in the RIMO files (see [[The_RIMO|here]]). The RIMO files for future Planck data releases will also include the detector level spectra. |
| + | |||
| + | <div id="sec:EFF"></div> | ||
==== Optical efficiency ==== | ==== Optical efficiency ==== | ||
| − | |||
| − | The optical efficiency tests, hereafter the EFF tests, were conducted to allow an estimate of the overall optical efficiency of the HFI detectors. These tests involved exposing the HFI detectors to a known blackbody source and observing the response, and comparing this to a theoretical model in combination with the detector spectral response data. The optical efficiency parameter derived for each detector is | + | The optical efficiency tests, hereafter the EFF tests, were conducted to allow an estimate of the overall optical efficiency of the HFI detectors. These tests involved exposing the HFI detectors to a known blackbody source and observing the response, and comparing this to a theoretical model in combination with the detector spectral response data. The optical efficiency parameter derived for each detector is considered as a multiplicative factor to be combined with the normalized transmission spectra (spectra whose maxima are set to one). This product is an estimate of the absolute spectral transmission of a given HFI detector. The detector optical efficiency parameters are included within the header of the detector spectra in the RIMO files ([[The_RIMO|here]]). |
| − | Further details regarding the derivation of the optical efficiencies are provided [[ | + | Further details regarding the derivation of the optical efficiencies are provided [[HFI_optical_efficiency|here]]. |
=== Data processing and Fourier transformation === | === Data processing and Fourier transformation === | ||
| − | Having identified the data sections that are of interest, here | + | Having identified the data sections that are of interest, here we describe the data processing sequence used to obtain the resulting spectra. The processing steps taken are as follows: |
| − | # | + | # selection and extraction of time-sampled data sets; |
| − | # | + | # conversion of time-sampled data to arrays of Optical Path Difference (OPD) sampled interferogram data sets; |
| − | # Fourier transformation and averaging of interferogram data sets | + | # Fourier transformation and averaging of interferogram data sets; |
| − | # | + | # discrimination of poor quality spectra by standard deviation comparison (see [[HFI spectral response data processing]]); |
| − | # | + | # division of detector spectra by reference bolometer spectra to obtain normalized spectral transmission profiles; |
| − | # | + | # combination of relative transmission spectra with filter measurements and waveguide models; |
| − | # | + | # determination of optical efficiency through evaluation of normalized spectral transmission in the context of the EFF experiments; |
| − | # | + | # addition of over-sampled data into spectrum for the CO transition regions (see [[HFI CO response]]); |
| − | # | + | # identification of common frequency sampling per channel and interpolation of spectra onto the common sampling. |
| − | Further details regarding the interferogram processing are provided [[ | + | Further details regarding the interferogram processing are provided [[HFI_spectral_response_data_processing|here]]. |
=== Reference bolometer spectra === | === Reference bolometer spectra === | ||
<!-- [sec:Bref] --> | <!-- [sec:Bref] --> | ||
| − | The reference bolometer spectra are obtained in a fashion similar to that used for the HFI detectors. Wherever possible, the same data processing is applied to the reference bolometer data as was applied to the HFI detector data, including optical filtering, scan speed, scan length, source intensity, apodization, phase correction | + | The reference bolometer is assumed to be spectrally flat across each HFI band to within 1%. Its spectra are obtained in a fashion similar to that used for the HFI detectors. Wherever possible, the same data processing is applied to the reference bolometer data as was applied to the HFI detector data, including optical filtering, scan speed, scan length, source intensity, apodization, and phase correction. The table included in [[HFI reference bolometer]] contains the reference bolometer data set properties corresponding to those listed for the HFI detectors in the table included in [[HFI spectral response data processing]]. Figures in [[HFI reference bolometer]] illustrate the resultant spectra and S/N from the reference bolometer data sets and compare the approximate S/N of the average spectrum for each detector against the reference bolometer average spectrum S/N over the same spectral region. |
| − | + | === Out-of-band spectral transmission content === | |
| − | |||
| − | === Out-of- | ||
<div id="sec:OOB"></div> | <div id="sec:OOB"></div> | ||
| − | The HFI detector spectral transmission profiles have been extended beyond the optical pass-band of the detectors. This is done by using a combination of a waveguide model and external filter measurements for the out-of-band regions of the detector spectral response. An uncertainty estimate for these additional spectral regions is also provided, however, it should be noted that the spectral uncertainty for the waveguide and filter spectra are determined indirectly (as described above/below). There is a transition from | + | The HFI detector spectral transmission profiles have been extended beyond the optical pass-band of the detectors. This is done by using a combination of a waveguide model and external filter measurements for the out-of-band regions of the detector spectral response. An uncertainty estimate for these additional spectral regions is also provided, however, it should be noted that the spectral uncertainty for the waveguide and filter spectra are determined indirectly (as described above/below). There is a transition from integrated HFI FTS data to filter data for every band edge that is defined by an optical filter. For the 100, 143, 217, and 353 GHz bands this is the high frequency cut-off band edge. For the 545 and 857 GHz bands a separate filter is used to define each of the high and low frequency band edges. For the spectral regions outside of the HFI detector optical bands, first the integrated HFI FTS data are used to qualitatively verify that there are no spectral leaks or features, and then the external filter measurements are grafted onto the ratioed spectra, where they better represent the relative spectral transmission. |
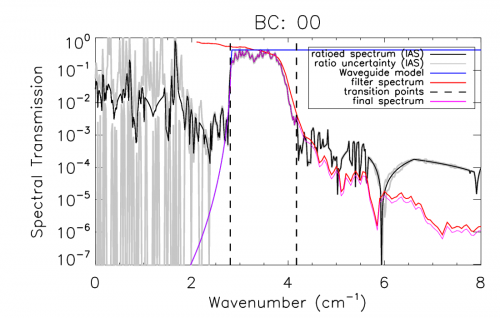
| − | The normalized | + | The normalized (HFI detector spectrum divided by the reference bolometer spectrum) spectrum and filter are both scaled by the optical efficiency (see [[HFI optical efficiency]]). For the 100-353 bands, the filter spectrum is also scaled by λ<sup>2</sup> to account for single-moded throughput normalization. This frequency scaling results in a more accurate in- and near-band match between the two sets of spectra, at the cost of less accuracy at much higher frequencies, where any transmission will not be single-moded. As transmission at higher frequencies is significantly reduced, this trade-off is acceptable. The 545 and 857 GHz bands have their filter spectra given without the additional frequency scaling, since this is not correct for multi-moded propagation. Both lower and upper frequency thresholds, ν<sub>l</sub>, and ν<sub>u</sub>, are defined for each band, below and above which the integrated HFI FTS spectra and/or the composite filter spectra must be used, respectively. This is done to avoid introducing any detector nonlinearity residuals into the final spectral transmission data products. The region between these two points is defined as the transition region; within this region the amplitudes and slopes of the integrated HFI and filter spectra are used to determine the spectral cross-over/transition point. Additional checks are performed to ensure that non-physical data processing artefacts are not introduced into the spectral transition region. Additionally, a similar technique is used, with decreasing frequency (instead of increasing), for the 545 and 857 GHz bands, with a filter-induced frequency cut-on. The figure illustrates an example of both the FTS and filter spectra used in extending the transmission profiles beyond the HFI optical bands. |
| − | [[Image:OOBstitch_bc00_Prad_Apod5_v302_sm.png|thumb|500px|center|alt=image|Demonstration of the combination of the waveguide model spectrum (left), the HFI measured spectrum (centre), and the combined filter spectra (right) | + | [[Image:OOBstitch_bc00_Prad_Apod5_v302_sm.png|thumb|500px|center|alt=image|Demonstration for a specific HFI detector of the combination of the waveguide model spectrum (left), the HFI measured spectrum (centre), and the combined filter spectra (right).]] |
| − | === Waveguide | + | === Waveguide model === |
<div id="sec:WG"></div> | <div id="sec:WG"></div> | ||
| − | A waveguide model is used to provide the data for the lowest frequency portion of the HFI detector spectral transmission. For the 100, 143, 217, and 353 GHz bands the waveguide model is transitioned (with increasing frequency) to the FTS ratioed spectra directly. There is an intermediate transition to the filter data, and then the ratioed spectra for the 545 and 857 GHz bands. For each detector, the waveguide transmission, < | + | A waveguide model is used to provide the data for the lowest frequency portion of the HFI detector spectral transmission. For the 100, 143, 217, and 353 GHz bands the waveguide model is transitioned (with increasing frequency) to the FTS ratioed spectra directly. There is an intermediate transition to the filter data, and then the ratioed spectra for the 545 and 857 GHz bands are used. For each detector, the waveguide transmission, <I>W(σ)</I>, is given by the following relation |
<math>\label{eq:WGmodel} | <math>\label{eq:WGmodel} | ||
W(\sigma) = \left\{ \begin{array}{lcl} | W(\sigma) = \left\{ \begin{array}{lcl} | ||
| − | \exp{\left[ -\displaystyle\left(\sqrt{(c_{nm}/r_{w})^2 - (2\pi\sigma)^2}\right) \left( | + | \exp{\left[ -\displaystyle\left(\sqrt{(c_{\rm nm}/r_{\rm w})^2 - (2\pi\sigma)^2}\right) \left( l_{\rm w} \right) \right]} & , & \mbox{ for }\sigma \leq c_{\rm nm}/(2\pi r_{\rm w}) \\ |
| − | 1 & , & \mbox{ for }\sigma > c_{nm}/(2\pi | + | 1 & , & \mbox{ for }\sigma > c_{\rm nm}/(2\pi r_{\rm w}) |
\end{array}\right.~,</math> | \end{array}\right.~,</math> | ||
| − | where | + | where σ is the frequency in cm<sup>-1</sup>, <I>r</I><sub>w</sub> is the waveguide radius in cm, <I>l</I><sub>w</sub> is the waveguide length in cm, and <I>c</I><sub>nm</sub> is a waveguide specific constant, 1.841 for the TE<sub>11</sub>/TM<sub>11</sub> (HE<sub>11</sub>) hybrid mode in this case. The table in [[HFI detector feedhorn model_parameters]] lists the waveguide radii and lengths resulting from the waveguide model fit to the ratioed spectra. As all of the feedhorns for a given band are meant to be identical (i.e., within mechanical manufacturing tolerances) the uncertainty of the waveguide transmission is estimated statistically using all of the waveguide models for each band. In other words, for <I>n</I> bands, the uncertainty at each spectral data point is determined by the standard deviation of <I>n</I> transmission values at that frequency. As a result of each detector in a given band having a unique cut-on frequency, this method over-estimates the uncertainty for frequencies approaching the cut-on; for regions very near the waveguide cut-on, the uncertainty is extrapolated from the ratioed spectrum as a more accurate representation. |
| − | |||
| − | |||
=== CO interpolation === | === CO interpolation === | ||
<div id="sec:CO"></div> | <div id="sec:CO"></div> | ||
| − | The | + | The integrated FTS/Saturn data taken with the HFI detectors is limited to a spectral resolution of approximately 0.017 cm<sup>-1</sup>(≈ 0.5 GHz) by the mechanical travel of the FTS translation stage. This corresponds to an unapodized FTS Instrument Line Shape (ILS) FWHM of about 0.020 cm<sup>-1</sup> (= 0.61 GHz). |
| − | In order to provide an improved estimate of the spectral transmission near the CO features, an interpolation of the spectra by a factor of | + | In order to provide an improved estimate of the spectral transmission near the CO features, an interpolation of the spectra by a resolution factor of about 10 has been performed. This over-sampling was accomplished by zero-padding the FTS interferograms prior to Fourier transformation, and subsequently incorporated into the Nyquist-sampled spectral data near the CO transitions (see [[#tab:CO|the CO table]]). Although the data are presented at higher resolution, the resolution of independent data points is not improved, i.e., the ILS line-width remains the same. A flag column has been added to the spectral transmission profile data files to indicate whether a given data point originates from the actual data, or is a result of the ILS-based interpolation. The region of the over-sampled, interpolated, data has been extended to also include other CO isotopologues; the CO <I>J</I>=1→0 to <I>J</I>=9→8 transitions should be fully sampled for CO, <sup>13</sup>CO, C<sup>17</sup>O, and C<sup>18</sup>O. The original data points within the over-sampled region have been preserved, i.e., every tenth data point (the data point that is not an interpolated one) is flagged with a zero rather than a one. This is indicated by the data flag, so a flag filter on the data will restore the independent data points easily. The figure below illustrates the regions where this over-sampling has been incorporated into the spectral transmission profiles. |
| + | [[Image:COflags_v300_sm.png|thumb|500px|center|alt=image|CO regions over which the spectral transmission was interpolated using the FTS instrument line shape.]] | ||
| − | + | An example of the over-sampled spectra is shown in the figure below for the 100 GHz detectors. | |
| + | [[Image:COJ10_HFI100_SpecTrans_v300_Apod5_sm.png|thumb|500px|center|alt=image|An example of the spectral transmission within 100 GHz detectors around the CO <I>J</I>=1→0 rotational transition.]] | ||
| + | Details of the HFI CO data products are available in the [[CMB_and_astrophysical_component_maps#CO_emission_maps|CO emission maps]] section. | ||
| + | |||
| + | <center> | ||
<div id="tab:CO"></div> | <div id="tab:CO"></div> | ||
{| border=1 | {| border=1 | ||
| − | + | | Band [GHz] || CO transition (<I>J</I><sub>upper</sub>→<I>J</I><sub>lower</sub>) || Frequency ν<sub>0</sub> [GHz] || Over-sampled region [GHz] | |
| − | |||
| − | | Band | ||
|- | |- | ||
| − | | 100 || 1 | + | | 100 || 1→0 || 115.2712018 || 109.67–115.39 |
|- | |- | ||
| − | | 143 || 1 | + | | 143 || 1→0 || 115.2712018 || 109.67–115.39 |
|- | |- | ||
| − | | 143 || 2 | + | | 143 || 2→1 || 230.5380000 || 219.34–230.77 |
|- | |- | ||
| − | | 217 || 2 | + | | 217 || 2→1 || 230.5380000 || 219.34–230.77 |
|- | |- | ||
| − | | 353 || 3 | + | | 353 || 3→2 || 345.7959899 || 329.00–346.15 |
|- | |- | ||
| − | | 545 || 4 | + | | 545 || 4→3 || 461.0407682 || 438.64–461.51 |
|- | |- | ||
| − | | 545 || 5 | + | | 545 || 5→4 || 576.2679305 || 548.28–576.85 |
|- | |- | ||
| − | | 857 || 6 | + | | 857 || 6→5 || 691.4730763 || 657.89–692.17 |
|- | |- | ||
| − | | 857 || 7 | + | | 857 || 7→6 || 806.6518060 || 767.48–807.46 |
|- | |- | ||
| − | | 857 || 8 | + | | 857 || 8→7 || 921.7997000 || 877.04–922.73 |
|- | |- | ||
| − | | 857 || 9 | + | | 857 || 9→8 || 1036.9123930 || 986.57–1037.95 |
|} | |} | ||
| + | '''Regions of HFI spectral transmission profiles near CO transitions.''' | ||
| + | |||
| + | </center> | ||
| − | + | === Spectral response conclusions and conformity with requirements === | |
| + | <div id="sec:req"></div> | ||
| + | The two defining requirements indicated in the HFI calibration plan are the acquisition of the spectral transmission of the single detectors with a prescribed accuracy and spectral resolution. The desired accuracy is 3% for the low frequency channels (100, 143, and 217 GHz) and 1% for the high frequency channels (353, 545, and 857 GHz). The spectral resolution requirement is for a resolution superior to 0.1 cm<sup>-1</sup>. | ||
| − | + | The spectral resolution requirement has been exceeded by more than a factor of 5. It is also possible to degrade the spectral resolution to the 0.1 cm<sup>-1</sup> requirement to gain an improvement in the S/N. | |
| − | + | No quantitative requirement existed regarding the blocking of high frequency (near-IR, visible, UV) radiation outside the range of the instrument. Checks in order to quantify the rejection have been performed at subsystem level and estimates of the out-of-band transmission profiles have been incorporated into the data products. The high level of out-of-band signal attenuation is verified by in-flight observations, as demonstrated in {{PlanckPapers|planck2013-p03d}}. | |
| − | + | ||
| − | + | Considering statistical fluctuations in the determination of the spectra, these goals have been achieved. There are, however, caveats regarding the nature of error bars when dealing with frequency space. The nature of uncertainties in spectral determination is less obvious than when dealing with timestream data. Systematic effects produced from instrumental setup, but also by data reduction, can in some cases exceed the actual statistical oscillation in the determination of the final spectra. This is the case for the high-frequency data, for instance, where the statistical fluctuation of the different determinations of the spectra in some case are better than 1 part in 10^<sup>3</sup>. | |
| + | |||
| + | A second caveat regards the method of data analysis of the calibration test data, for which the ratio with the reference bolometer data (of which the relative error is a function of frequency) introduces an error that increase with wavelength. With the spectral resolution of the data provided being much higher than the stated 0.1 cm<sup>-1</sup>, the transmission accuracy requirement is not met for the 100 GHz detectors. It is possible to degrade the spectral resolution to the 0.1cm<sup>-1</sup> level to allow the accuracy to achieve the required level, but the higher spectral resolution data have been provided to better assist with the CO contamination removal from the 100 GHz signal. | ||
| − | + | Figures containing the full spectral response of each HFI detector, and band-averaged spectra, are provided in the Appendix [ref.]. Details of the generation of band-averaged spectra, unit conversion coefficients, and colour correction coefficients are provided in the data processing sections of this Explanatory Supplement. IDL scripts have been provided along with the PLA to allow users to generate unit conversion and colour correction coefficients; these are described in the [[Unit conversion and Color correction]] section. | |
| − | + | Further details regarding the use of the spectral response of the HFI detectors are found in the [[Spectral_response|spectral response]] section. | |
| − | + | == References == | |
| + | <References /> | ||
| − | |||
| − | |||
| − | + | [[Category:HFI design, qualification and performance|002]] | |
| − | [[Category: | ||
Latest revision as of 22:54, 12 November 2014
Contents
- 1 Horns, lenses and filters
- 2 Spectral response
- 3 References
Horns, lenses and filters[edit]
The cold optics are described in Planck-PreLaunch-I[1].
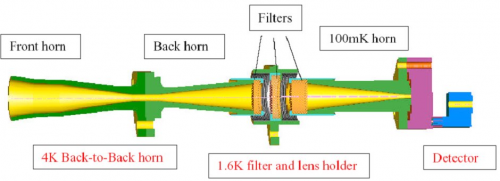
In order to meet straylight, beam shape and filtering requirements, a design using feedhorn-coupled detectors was chosen, with a triple horn configuration (see figure below). A detailed description of the HFI optical design and beam performance is given in Planck-PreLaunch-V[2].
Horn design and patterns[edit]
The cosmological channels (100 GHz, 143 GHz, 217 GHz, 353 GHz) have been designed to detect a single mode with one or two polarizations, for Polarization Sensitive Bolometers (PSBs) or Spider Web Bolometers (SWBs), respectively. The spectral and geometrical properties of the horns have been characterized individually. A typical example for a single-moded horn is given in the figure below.
The beam fits are excellent down to very low levels, which validates, at least for single-moded horns, the philosophy that prevailed for their development: modelling and optimizing the horns before implementation and then validating the model with a complete measurement of the beam intensity patterns. For the single-moded horns, a method has been developed to use the measured intensities, together with the phase information from modeling to derive “worst-case” horn beam patterns that can be used in GRASP simulations of the telescope beams (phase information is mandatory). Worst-case beam patterns have been computed for all single-moded HFI horn types in order to estimate an upper limit of the spillover. As an example, in the figure below, we show the difference in encircled power at isolevel intervals for the HFI 143_1a channel main beam, using both the model and worst-case patterns.
In the high frequency 545 GHz and 857 GHz Planck channels both the back-to-back (BTB) horns and the detector horn have "overmoded" waveguide filters [3]. The far-field patterns of the horns (which illuminate the Planck mirrors) have been simulated, and are shown in the two figures below for a few spot frequencies across the 857 GHz band. Note that the edge taper is approx -30 dB at 25°, as required at the centre of the band. Superimposed is the broadband measurement, which clearly looks narrower than the majority of the spot frequency measurements and requires explanation. The measured far-field beam patterns across the band are narrower than the predicted far-field beams right across the band. The simulated beams are too wide, suggesting missing higher order modes, either due to attenuation between the cavity and the BTB, or arising from the experimental setup.
Spectral response[edit]
The measurement of the spectral response of HFI is fully described in Planck-2013-IX[4]. The experimental setup, data collection, and related data processing are described. The official version of the HFI detector spectral transmission profiles is available within the HFI instrument model and the RIMO files in the Planck Legacy archive. These data are comprised of broadband Fourier transform spectrometer (FTS) measurements conducted with the HFI focal plane assembly in a ground-based test cryostat, and include a waveguide model for the low frequency spectral region, and component-level filter spectra for the remaining out-of-band spectral regions. Specific attention is given to in-band and near-band spectral regions surrounding CO rotational transitions, in order to support the CO extraction component separation effort Planck-2013-XIII[5]Planck-2013-XII[6]. The spectral transmission profiles are evaluated with parameters such as cut-on, cut-off, centre frequency, effective frequency (including spectral index), and band-width, all provided in this analysis. Further evaluation yields band-averaged spectra and unit conversion / colour correction coefficients Planck-2013-IX[4], as well as software routines to generate additional unit conversion and colour correction coefficients, i.e., the unit conversion and colour correction (UCCC) routines.
The main goal of the spectral transmission tests of the HFI instrument is to measure individually the spectral response of all HFI detectors to a known source of EM radiation. This was determined by measuring the interferometric output of all detection channels for radiation propagated through a continuously scanned polarizing FTS. The required accuracy to which the spectral transmission is to be recovered is 1%. It is important to note that the absolute spectral calibration cannot be achieved solely from the analysis of the FTS data, because of uncertainties in the coupling efficiency of the FTS source through the FTS, input optics, and integrating sphere. The relative FTS measurements must be combined with the optical efficiency tests, which used internal blackbody sources (see section HFI optical efficiency). A reference bolometer located in an intermediate integrating sphere (accepting 2π sr of incident radiation) within the FTS test setup was used to obtain a ratio with the HFI detector spectra against to determine the throughput-normalized relative transmission spectra for each HFI detector. Data were collected over a series of pre-flight test campaigns, and analysed using standard Fourier data processing techniques.
Additional experiments[edit]
Two significant additional tests were used in the derivation of the HFI detector spectral transmission profiles beyond the scope of the integrated HFI FTS measurements. Additional filter measurements were recorded at component level during filter stack production. These measurements were used to extend the integrated HFI FTS spectral measurements beyond the HFI spectral passband. The other experiments, herein the EFF tests, were used to obtain optical efficiency parameters for each detector, and thus an estimate of the absolute spectral transmission. These parameters, when combined with the respective normalized spectral transmission profiles, provide an estimate of the absolute spectral transmission. The EFF tests are discussed in greater detail in [7]. The filter measurements and the optical efficiency experiments are described below.
Filter measurements[edit]
Prior to the integrated HFI measurements with the integrated HFI detectors and filter stacks, FTS measurements were conducted of the individual filters comprising the filter stacks for each band. As discussed in this section, the independent measure of the filter stack transmission is used for a portion of the HFI detector spectral transmission for regions of the spectrum where it is deemed to be of better quality than the integrated HFI FTS measurements (i.e., for frequencies outside of the band edge filter cut-off(s)). The filter stacks for each of the frequency bands are comprised of five filters. There is an additional low frequency cut-on filter for the 545 and 857 GHz bands, because the waveguide cut-on is too low for these multi-moded channels. The figures below show the individual filter transmission measurements, as well as the combined filter stack product.
Combined (bottom) and individual (top) filter transmission measurements for the five filters within the HFI band filter stacks (six for 545 and 857 GHz).
The uncertainty on the combined filter transmission measurement is determined as follows. Let represent the individual filter transmission. The standard deviation of all values of below a threshold of is used as an approximate uncertainty for each individual filter measurement, i.e., . The individual uncertainty estimates are combined to provide an estimate of the combined filter transmission spectral uncertainty through standard error propagation. For the combined filter transmission, represented as , the associated uncertainty estimate is given as
As described below, the composite filter spectra illustrated above form part of the official HFI detector spectral response, specifically for a portion of the out-of-band spectral region. The band-averaged spectra, containing these data as a constituent, is provided in the RIMO files (see here). The RIMO files for future Planck data releases will also include the detector level spectra.
Optical efficiency[edit]
The optical efficiency tests, hereafter the EFF tests, were conducted to allow an estimate of the overall optical efficiency of the HFI detectors. These tests involved exposing the HFI detectors to a known blackbody source and observing the response, and comparing this to a theoretical model in combination with the detector spectral response data. The optical efficiency parameter derived for each detector is considered as a multiplicative factor to be combined with the normalized transmission spectra (spectra whose maxima are set to one). This product is an estimate of the absolute spectral transmission of a given HFI detector. The detector optical efficiency parameters are included within the header of the detector spectra in the RIMO files (here).
Further details regarding the derivation of the optical efficiencies are provided here.
Data processing and Fourier transformation[edit]
Having identified the data sections that are of interest, here we describe the data processing sequence used to obtain the resulting spectra. The processing steps taken are as follows:
- selection and extraction of time-sampled data sets;
- conversion of time-sampled data to arrays of Optical Path Difference (OPD) sampled interferogram data sets;
- Fourier transformation and averaging of interferogram data sets;
- discrimination of poor quality spectra by standard deviation comparison (see HFI spectral response data processing);
- division of detector spectra by reference bolometer spectra to obtain normalized spectral transmission profiles;
- combination of relative transmission spectra with filter measurements and waveguide models;
- determination of optical efficiency through evaluation of normalized spectral transmission in the context of the EFF experiments;
- addition of over-sampled data into spectrum for the CO transition regions (see HFI CO response);
- identification of common frequency sampling per channel and interpolation of spectra onto the common sampling.
Further details regarding the interferogram processing are provided here.
Reference bolometer spectra[edit]
The reference bolometer is assumed to be spectrally flat across each HFI band to within 1%. Its spectra are obtained in a fashion similar to that used for the HFI detectors. Wherever possible, the same data processing is applied to the reference bolometer data as was applied to the HFI detector data, including optical filtering, scan speed, scan length, source intensity, apodization, and phase correction. The table included in HFI reference bolometer contains the reference bolometer data set properties corresponding to those listed for the HFI detectors in the table included in HFI spectral response data processing. Figures in HFI reference bolometer illustrate the resultant spectra and S/N from the reference bolometer data sets and compare the approximate S/N of the average spectrum for each detector against the reference bolometer average spectrum S/N over the same spectral region.
Out-of-band spectral transmission content[edit]
The HFI detector spectral transmission profiles have been extended beyond the optical pass-band of the detectors. This is done by using a combination of a waveguide model and external filter measurements for the out-of-band regions of the detector spectral response. An uncertainty estimate for these additional spectral regions is also provided, however, it should be noted that the spectral uncertainty for the waveguide and filter spectra are determined indirectly (as described above/below). There is a transition from integrated HFI FTS data to filter data for every band edge that is defined by an optical filter. For the 100, 143, 217, and 353 GHz bands this is the high frequency cut-off band edge. For the 545 and 857 GHz bands a separate filter is used to define each of the high and low frequency band edges. For the spectral regions outside of the HFI detector optical bands, first the integrated HFI FTS data are used to qualitatively verify that there are no spectral leaks or features, and then the external filter measurements are grafted onto the ratioed spectra, where they better represent the relative spectral transmission.
The normalized (HFI detector spectrum divided by the reference bolometer spectrum) spectrum and filter are both scaled by the optical efficiency (see HFI optical efficiency). For the 100-353 bands, the filter spectrum is also scaled by λ2 to account for single-moded throughput normalization. This frequency scaling results in a more accurate in- and near-band match between the two sets of spectra, at the cost of less accuracy at much higher frequencies, where any transmission will not be single-moded. As transmission at higher frequencies is significantly reduced, this trade-off is acceptable. The 545 and 857 GHz bands have their filter spectra given without the additional frequency scaling, since this is not correct for multi-moded propagation. Both lower and upper frequency thresholds, νl, and νu, are defined for each band, below and above which the integrated HFI FTS spectra and/or the composite filter spectra must be used, respectively. This is done to avoid introducing any detector nonlinearity residuals into the final spectral transmission data products. The region between these two points is defined as the transition region; within this region the amplitudes and slopes of the integrated HFI and filter spectra are used to determine the spectral cross-over/transition point. Additional checks are performed to ensure that non-physical data processing artefacts are not introduced into the spectral transition region. Additionally, a similar technique is used, with decreasing frequency (instead of increasing), for the 545 and 857 GHz bands, with a filter-induced frequency cut-on. The figure illustrates an example of both the FTS and filter spectra used in extending the transmission profiles beyond the HFI optical bands.
Waveguide model[edit]
A waveguide model is used to provide the data for the lowest frequency portion of the HFI detector spectral transmission. For the 100, 143, 217, and 353 GHz bands the waveguide model is transitioned (with increasing frequency) to the FTS ratioed spectra directly. There is an intermediate transition to the filter data, and then the ratioed spectra for the 545 and 857 GHz bands are used. For each detector, the waveguide transmission, W(σ), is given by the following relation
where σ is the frequency in cm-1, rw is the waveguide radius in cm, lw is the waveguide length in cm, and cnm is a waveguide specific constant, 1.841 for the TE11/TM11 (HE11) hybrid mode in this case. The table in HFI detector feedhorn model_parameters lists the waveguide radii and lengths resulting from the waveguide model fit to the ratioed spectra. As all of the feedhorns for a given band are meant to be identical (i.e., within mechanical manufacturing tolerances) the uncertainty of the waveguide transmission is estimated statistically using all of the waveguide models for each band. In other words, for n bands, the uncertainty at each spectral data point is determined by the standard deviation of n transmission values at that frequency. As a result of each detector in a given band having a unique cut-on frequency, this method over-estimates the uncertainty for frequencies approaching the cut-on; for regions very near the waveguide cut-on, the uncertainty is extrapolated from the ratioed spectrum as a more accurate representation.
CO interpolation[edit]
The integrated FTS/Saturn data taken with the HFI detectors is limited to a spectral resolution of approximately 0.017 cm-1(≈ 0.5 GHz) by the mechanical travel of the FTS translation stage. This corresponds to an unapodized FTS Instrument Line Shape (ILS) FWHM of about 0.020 cm-1 (= 0.61 GHz).
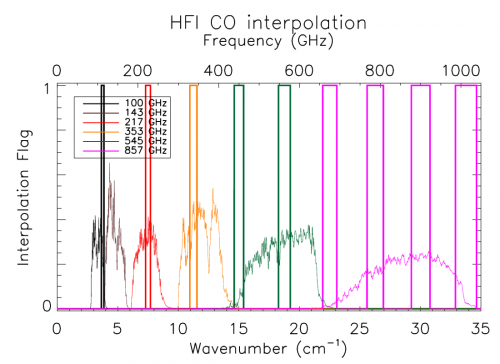
In order to provide an improved estimate of the spectral transmission near the CO features, an interpolation of the spectra by a resolution factor of about 10 has been performed. This over-sampling was accomplished by zero-padding the FTS interferograms prior to Fourier transformation, and subsequently incorporated into the Nyquist-sampled spectral data near the CO transitions (see the CO table). Although the data are presented at higher resolution, the resolution of independent data points is not improved, i.e., the ILS line-width remains the same. A flag column has been added to the spectral transmission profile data files to indicate whether a given data point originates from the actual data, or is a result of the ILS-based interpolation. The region of the over-sampled, interpolated, data has been extended to also include other CO isotopologues; the CO J=1→0 to J=9→8 transitions should be fully sampled for CO, 13CO, C17O, and C18O. The original data points within the over-sampled region have been preserved, i.e., every tenth data point (the data point that is not an interpolated one) is flagged with a zero rather than a one. This is indicated by the data flag, so a flag filter on the data will restore the independent data points easily. The figure below illustrates the regions where this over-sampling has been incorporated into the spectral transmission profiles.
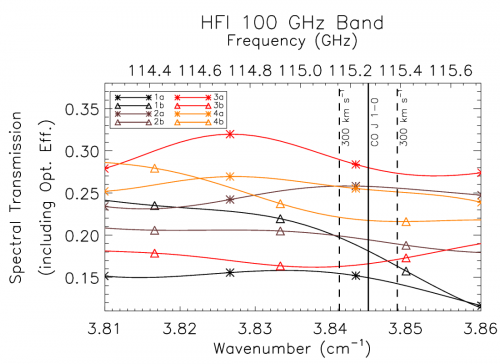
An example of the over-sampled spectra is shown in the figure below for the 100 GHz detectors.
Details of the HFI CO data products are available in the CO emission maps section.
| Band [GHz] | CO transition (Jupper→Jlower) | Frequency ν0 [GHz] | Over-sampled region [GHz] |
| 100 | 1→0 | 115.2712018 | 109.67–115.39 |
| 143 | 1→0 | 115.2712018 | 109.67–115.39 |
| 143 | 2→1 | 230.5380000 | 219.34–230.77 |
| 217 | 2→1 | 230.5380000 | 219.34–230.77 |
| 353 | 3→2 | 345.7959899 | 329.00–346.15 |
| 545 | 4→3 | 461.0407682 | 438.64–461.51 |
| 545 | 5→4 | 576.2679305 | 548.28–576.85 |
| 857 | 6→5 | 691.4730763 | 657.89–692.17 |
| 857 | 7→6 | 806.6518060 | 767.48–807.46 |
| 857 | 8→7 | 921.7997000 | 877.04–922.73 |
| 857 | 9→8 | 1036.9123930 | 986.57–1037.95 |
Regions of HFI spectral transmission profiles near CO transitions.
Spectral response conclusions and conformity with requirements[edit]
The two defining requirements indicated in the HFI calibration plan are the acquisition of the spectral transmission of the single detectors with a prescribed accuracy and spectral resolution. The desired accuracy is 3% for the low frequency channels (100, 143, and 217 GHz) and 1% for the high frequency channels (353, 545, and 857 GHz). The spectral resolution requirement is for a resolution superior to 0.1 cm-1.
The spectral resolution requirement has been exceeded by more than a factor of 5. It is also possible to degrade the spectral resolution to the 0.1 cm-1 requirement to gain an improvement in the S/N.
No quantitative requirement existed regarding the blocking of high frequency (near-IR, visible, UV) radiation outside the range of the instrument. Checks in order to quantify the rejection have been performed at subsystem level and estimates of the out-of-band transmission profiles have been incorporated into the data products. The high level of out-of-band signal attenuation is verified by in-flight observations, as demonstrated in Planck-2013-IX[4].
Considering statistical fluctuations in the determination of the spectra, these goals have been achieved. There are, however, caveats regarding the nature of error bars when dealing with frequency space. The nature of uncertainties in spectral determination is less obvious than when dealing with timestream data. Systematic effects produced from instrumental setup, but also by data reduction, can in some cases exceed the actual statistical oscillation in the determination of the final spectra. This is the case for the high-frequency data, for instance, where the statistical fluctuation of the different determinations of the spectra in some case are better than 1 part in 10^3.
A second caveat regards the method of data analysis of the calibration test data, for which the ratio with the reference bolometer data (of which the relative error is a function of frequency) introduces an error that increase with wavelength. With the spectral resolution of the data provided being much higher than the stated 0.1 cm-1, the transmission accuracy requirement is not met for the 100 GHz detectors. It is possible to degrade the spectral resolution to the 0.1cm-1 level to allow the accuracy to achieve the required level, but the higher spectral resolution data have been provided to better assist with the CO contamination removal from the 100 GHz signal.
Figures containing the full spectral response of each HFI detector, and band-averaged spectra, are provided in the Appendix [ref.]. Details of the generation of band-averaged spectra, unit conversion coefficients, and colour correction coefficients are provided in the data processing sections of this Explanatory Supplement. IDL scripts have been provided along with the PLA to allow users to generate unit conversion and colour correction coefficients; these are described in the Unit conversion and Color correction section.
Further details regarding the use of the spectral response of the HFI detectors are found in the spectral response section.
References[edit]
- ↑ Planck pre-launch status: The optical architecture of the HFI, P. A. R. Ade, G. Savini, R. Sudiwala, C. Tucker, A. Catalano, S. Church, R. Colgan, F. X. Desert, E. Gleeson, W. C. Jones, J.-M. Lamarre, A. Lange, Y. Longval, B. Maffei, J. A. Murphy, F. Noviello, F. Pajot, J.-L. Puget, I. Ristorcelli, A. Woodcraft, V. Yurchenko, A&A, 520, A11+, (2010).
- ↑ Planck pre-launch status: HFI beam expectations from the optical optimisation of the focal plane, B. Maffei, F. Noviello, J. A. Murphy, P. A. R. Ade, J.-M. Lamarre, F. R. Bouchet, J. Brossard, A. Catalano, R. Colgan, R. Gispert, E. Gleeson, C. V. Haynes, W. C. Jones, A. E. Lange, Y. Longval, I. McAuley, F. Pajot, T. Peacocke, G. Pisano, J.-L. Puget, I. Ristorcelli, G. Savini, R. Sudiwala, R. J. Wylde, V. Yurchenko, A&A, 520, A12+, (2010).
- ↑ Shaped Corrugated Horns for Cosmic Microwave Background Anisotropy Measurements, B. Maffei, P.A.R. Ade, C.E. Tucker, E. Wakui, R.J. Wylde, J.A. Murphy, R.M. Colgan, International Journal of Infrared and Millimeter Waves, 21, 2023-2033, (2000).
- ↑ 4.04.14.2 Planck 2013 results. IX. HFI spectral response, Planck Collaboration, 2014, A&A, 571, A9
- ↑ Planck 2013 results. XIII. Galactic CO emission, Planck Collaboration, 2014, A&A, 571, A13
- ↑ Planck 2013 results. XI. Component separation, Planck Collaboration, 2014, A&A, 571, A11
- ↑ Développement de modèles numériques del'Instrument Haute Fréquence (HFI) de Planck nécessaires à son exploitation, A. Catalano, (PhD Thesis), École doctorale Astronomie et Astrophysique d'Ile de France, (2008).
(Planck) High Frequency Instrument
Back To Back HFI horns
Instrument Line Shape
Full-Width-at-Half-Maximum
Planck Legacy Archive
