Difference between revisions of "HFI reference bolometer"
(Created page with '{| border=1 |+ Properties of Ref. Bolometer Spectra <div "id=tab:BREF"></div> |- | Band (GHz) || # Ifgm. || # Spec. || MPD (cm) || ILS<math>_{\mbox{FWHM}}</math> (cm<math>^{-1}</…') |
|||
| (6 intermediate revisions by 3 users not shown) | |||
| Line 1: | Line 1: | ||
| + | <center> | ||
{| border=1 | {| border=1 | ||
| − | |+ Properties of | + | |+ '''Properties of reference bolometer spectra''' |
<div "id=tab:BREF"></div> | <div "id=tab:BREF"></div> | ||
|- | |- | ||
| Line 17: | Line 18: | ||
| 857 || 24 || 24 || 29.652306 || 0.020352549 || 388.23050 | | 857 || 24 || 24 || 29.652306 || 0.020352549 || 388.23050 | ||
|} | |} | ||
| + | </center> | ||
| − | + | <center> | |
| − | <gallery | + | <gallery widths="300px" heights="300px" perrow="3"> |
File:BREF_LowF_Apod5_avgSpec_SN_sm.png|100 - 217 GHz | File:BREF_LowF_Apod5_avgSpec_SN_sm.png|100 - 217 GHz | ||
File:BREF_HighF_Apod5_avgSpec_SN_sm.png|353 - 857 GHz | File:BREF_HighF_Apod5_avgSpec_SN_sm.png|353 - 857 GHz | ||
File:Bref_LowF_HighF_SN_sm.png|all bands | File:Bref_LowF_HighF_SN_sm.png|all bands | ||
</gallery> | </gallery> | ||
| + | '''Reference bolometer spectra and S/N.''' | ||
| + | </center> | ||
| − | <gallery | + | |
| + | <center> | ||
| + | <gallery widths="300px" heights="300px" perrow="3"> | ||
File:BREF_LowF_Apod5_avgSpec_SN_100_sm.png|100GHz | File:BREF_LowF_Apod5_avgSpec_SN_100_sm.png|100GHz | ||
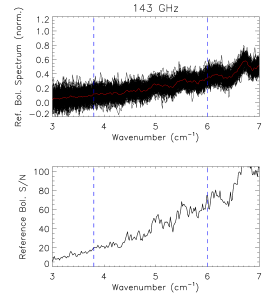
File:BREF_LowF_Apod5_avgSpec_SN_143_sm.png|143GHz | File:BREF_LowF_Apod5_avgSpec_SN_143_sm.png|143GHz | ||
| Line 33: | Line 39: | ||
File:BREF_HighF_Apod5_avgSpec_SN_857_sm.png|857GHz | File:BREF_HighF_Apod5_avgSpec_SN_857_sm.png|857GHz | ||
</gallery> | </gallery> | ||
| + | '''Reference bolometer spectra (top) and S/N (bottom) for each of the HFI bands (vertical bars represent band edges).''' | ||
| + | </center> | ||
| + | <center> | ||
| + | [[Image:SNall_sm.png|thumb|500px|center|Approximate S/N ratio for the individual HFI detector spectra and the reference bolometer spectra.]] | ||
| − | [[ | + | </center> |
| − | + | [[Category:HFI design, qualification and performance|008]] | |
| − | |||
Latest revision as of 20:11, 17 March 2013
| Band (GHz) | # Ifgm. | # Spec. | MPD (cm) | ILS (cm) | avg. S/N |
| 100 | 164 | 164 | 29.644698 | 0.020357772 | 11.478057 |
| 143 | 164 | 164 | 29.644698 | 0.020357772 | 37.361317 |
| 217 | 164 | 164 | 29.644698 | 0.020357772 | 126.14280 |
| 353 | 24 | 24 | 29.652306 | 0.020352549 | 136.06159 |
| 545 | 24 | 24 | 29.652306 | 0.020352549 | 314.58093 |
| 857 | 24 | 24 | 29.652306 | 0.020352549 | 388.23050 |
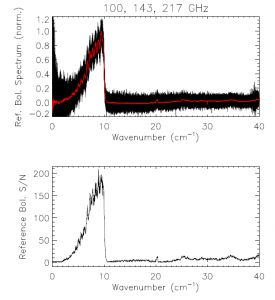
100 - 217 GHz
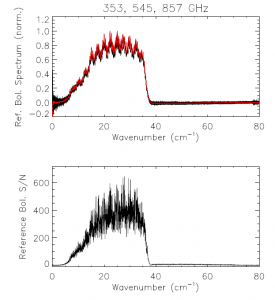
353 - 857 GHz
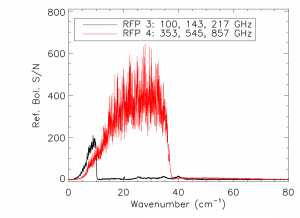
all bands


Reference bolometer spectra and S/N.
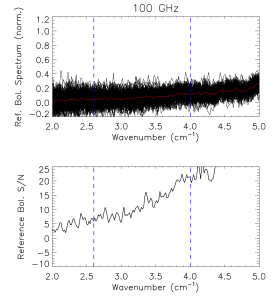
100GHz
143GHz
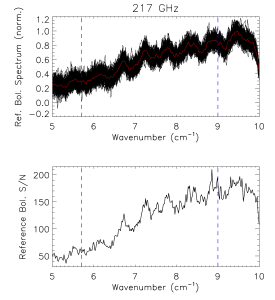
217GHz
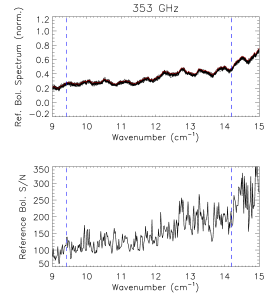
353GHz
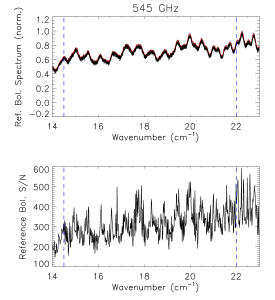
545GHz
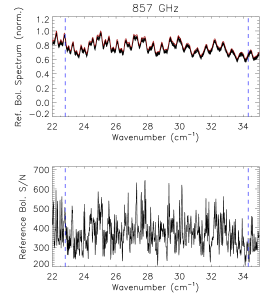
857GHz


Reference bolometer spectra (top) and S/N (bottom) for each of the HFI bands (vertical bars represent band edges).

Instrument Line Shape
Full-Width-at-Half-Maximum
(Planck) High Frequency Instrument