Difference between revisions of "Radiation environment"
| Line 4: | Line 4: | ||
<center> | <center> | ||
| − | <gallery style="padding:0 0 0 0;" perrow= | + | <gallery style="padding:0 0 0 0;" perrow=2 widths=280px heights=175px> |
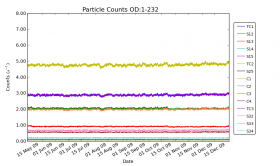
File: SREM2009.png| '''Radiation environment 2009''' | File: SREM2009.png| '''Radiation environment 2009''' | ||
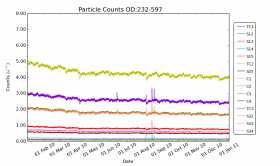
File: SREM2010.png | '''Radiation environment 2010''' | File: SREM2010.png | '''Radiation environment 2010''' | ||
Revision as of 13:44, 19 August 2013
The Standard Radiation Environment Monitor on board Planck #SREM is a particle detector flown on several ESA satellites. The SREM consists of several detectors sensitive to different energy ranges, which can also be used in coincidence mode. In particular, the SREM measures count rates of high energy protons with E>20 MeV, electrons with E>0.5 MeV and Ions with 150 MeV < E < 185 MeV.
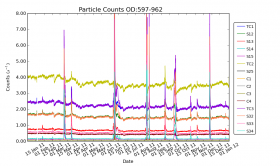
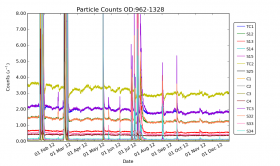
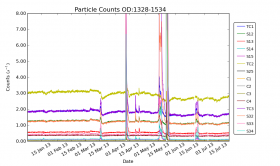
Particle fluxes measured by the SREM on board Planck are shown in the figures below. Each plot in the set below shows the SREM radiation measurements during one full year (except for the first plot showing SREM measurements from launch - May the 14th 2009 - and the last plot with data from January 1st 2013 to October 23rd 2013 - the end of the mission). The plots show all the energy channels available in the SREM.
The radiation environment of Planck is characterised by a start near the minimum in the current solar cycle. As a consequence, the particle flux is dominated by Galactic cosmic rays, rather than by the solar wind. The figure below shows the thermal and radiation environment around Planck during the nominal mission. Vertical lines indicate boundaries between surveys. The top panel shows the cosmic
ray flux as measured by the onboard SREM; its decrease over time is due to the corresponding increase in solar activity, indicated by the sunspot
number, from the Solar Influences Data Centre. Solar flares show up as spikes in the proton flux. The second and third panels show the temperature
variation at two representative locations in the room-temperature SVM, i.e., on one of the (HFI) Helium tanks and on one of the LFI back-end
modules (BEM). The sine-wave modulation tracks the variation of distance from the Sun. The bottom panel shows the temperature evolution of
VG3, the coldest of three so-called V-grooves, to which the sorption cooler is heat-sunk. The disturbances on the curve are due to adjustments of
the operational parameters of this cooler.
The time evolution of the SREM measurements is well correlated with that of identical units flying simultaneously on other satellites (e.g., Herschel, Rosetta) and with indicators of Galactic cosmic rays, and is anti-correlated with solar flare events and with the solar cycle. More importantly for Planck, the SREM measurements are very well correlated with the heat deposition on the coldest stages of the HFI, and with glitch rates measured by the detectors of HFI. A more detailed interpretation of these data is provided in planck2011-1-5.
References[edit]
<biblio force=false>
</biblio>
Space Radiation Environment Monitor
European Space Agency
Service Module
(Planck) High Frequency Instrument
(Planck) Low Frequency Instrument
LFI warm electronics Back End Module
