Difference between revisions of "LFI design, qualification, and performance"
| Line 748: | Line 748: | ||
== LFI Systematics Effects == | == LFI Systematics Effects == | ||
| + | The LFI design was driven by the need to suppress systematic effects well below instrument white noise. The differential receiver scheme, with reference loads cooled to 4 K, greatly minimises the effect of 1/f noise and common-mode fluctuations, such as thermal perturbations in the 20K LFI focal plane. The use of a gain modulation factor (see Eq. (xx)) largely compensates for spurious contributions from input offsets. Furthermore, diode averaging (Eq. (xx)) allows us to cancel second-order correlations such as those originating from phase switch imbalances. | ||
| + | We have developed an error budget for systematic effects (<cite>#planck2011-1-4, bersanelli2010</cite> [{{PEarly|3|link=Planck early results. First assessment of the Low Frequency Instrument in-flight performance}}],{{PPreLaunch|4|link=Planck pre-launch status: Design and description of the Low Frequency Instrument}}]) as a reference for both instrument design and data analysis. Our goal is to ensure that each systematic effect is rejected to the specified level, either by design or by robust removal in software. At this stage, the following effects are relevant: | ||
| + | : – 1/ f noise; | ||
| + | : – 1Hz frequency spikes; | ||
| + | : – thermal fluctuations in the back-end modules driven by temperature oscillations from the transponder during the first survey; | ||
| + | : – thermal fluctuations in the 20 K focal plane; | ||
| + | : – thermal fluctuations of the 4 K reference loads. | ||
| − | + | For each of these effects we used flight data and information from ground tests to build timelines, maps, and angular power spectra that represent our best knowledge of their impact on the scientific analysis. | |
| + | The details of the systematic effect analysis is given in section xxxx. | ||
== Acronyms == | == Acronyms == | ||
Revision as of 22:12, 12 February 2013
Contents
Overview[edit]
The Planck-LFI instrument is an array of 11 radiometric receivers in the Ka, Q and V bands, with centre frequencies close to 30, 44 and 70 GHz. The exact centre frequencies for each receiver are reported in #planck2011-1-4 [Planck early results. First assessment of the Low Frequency Instrument in-flight performance]; for simplicity, here we will refer to the three channels using their nominal centre frequency. A detailed description of the LFI instrument is given in #bersanelli2010 [Planck pre-launch status: Design and description of the Low Frequency Instrument], and references therein.
The LFI description[edit]
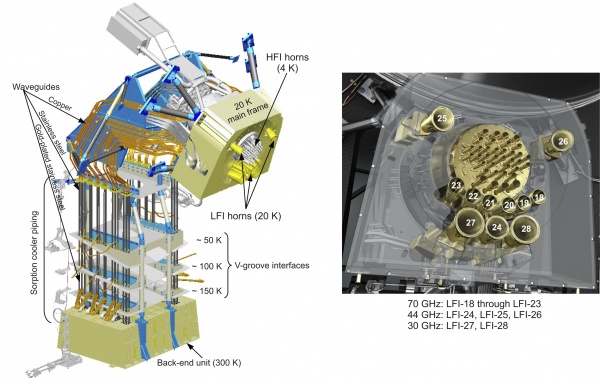
The LFI instrument (see Figure 1 below) consists of a 20 K focal plane unit hosting the corrugated feed horns, the orthomode transducers (OMTs) and the receiver front-end modules (FEMs). Forty four composite waveguides #darcangelo2009a are interfaced with three conical thermal shields and connect the front-end modules to the warm (~300 K) back-end unit (BEU) containing a further radio frequency amplification stage, detector diodes and all the electronics for data acquisition and bias supply.
Best LFI noise performance is obtained with receivers based on InP High Electron Mobility Transistor (HEMT) low noise amplifiers (LNAs) for minimal power dissipation and best performance. To further minimise power consumption in the focal plane, the radiometers are split into two sub-assemblies connected by waveguides, one located at the telescope focal area, the other on the 300 K portion of the Planck satellite. These design features allow the entire front-end LNAs dissipation to be <0.55 W, which enables the active cooling of the focal assembly. This is achieved with a vibration-less hydrogen sorption cooler, which also provides 18 K pre-cooling to the HFI helium J-T cooler. Two sorption cooler units are included in the flight hardware.
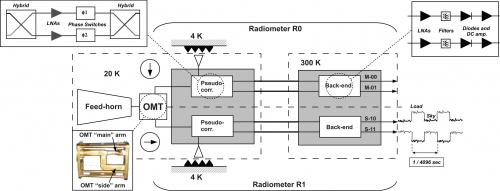
As shown schematically in Figure 2 below, the LFI consists of the following subsystems:
- Radiometer Array Assembly (RAA)
- Sorption Cooler Subsystem (SCS)
- Radiometer Electronics Box Assembly (REBA)
The RAA includes the Front End Unit (FEU) and the Back End Unit (BEU), connected via waveguides. The FEU is located at the focus of the telescope, as one component of the joint LFI/HFI focal assembly (see sections below). The BEU is mounted on the top of the Planck SVM. The REBA and the warm parts of the Sorption Cooler System (SCS) is located on one of the lateral panels of the service module (SVM). The FEU and the Sorption Cooler Compressor (SCC) are connected by concentric stainless steel tubes. The smaller tube carries hydrogen at ∼60 atmospheres from the cooler compressors to the FEU, while the larger tube returns the hydrogen at ∼0.3 atmospheres. These units are described in detail in following sections, the SCS is described in details in the satellite section dedicated to Cryogenics. All LFI units are linked together by the LFI harness, which also connects to the spacecraft interface.
Radiometer Array Assembly (RAA)[edit]
The Radiometer Array Assembly (RAA) consists of two main units (the front end unit, FPU and the Back End Unit, BEU), connected by a set of waveguides. The Focal Plane Unit (FPU) is the heart of the LFI instrument and it contains the feed array and associated orthomode transducers (OMTs) and FEMs, all cooled to 20 K by the sorption cooler. The FPU comprises a set of 11 modules, which are mounted on a mechanical support which meets the thermo-mechanical requirements of the instrument and adds thermal inertia. The BEU comprises the radiometer Back End Modules (BEM) and the Data Acquisition Electronics (DAE), which are connected by an internal harness. The HFI Unit is located inside the LFI FPU and supported by the LFI structure. The LFI structure gives the mechanical and thermal interface to the HFI unit with the proper stiffness and thermal de-coupling. The LFI structure also guarantees the proper alignment of the HFI detector with the telescope focal plane.
The time scale of the stability of the receiver is driven by the 1 rpm rotation speed of the spacecraft, which requires a very low 1/f-noise or gain variation of the low noise amplifiers and other components. The LFI uses a pseudo-correlation receiver concept (Figure 3 below). This radiometer concept is chosen to maximise the stability of the instrument by reducing the effect of non-white noise generated in the radiometer itself. In this scheme, the difference between the inputs to each of the chains (the signal from the telescope and that from a reference black body respectively) is continuously being observed. To remove the effect of instability in the back-end amplifiers and detector diodes, it is necessary to switch the signal detected at the diodes at high rate. The signals from the sky and from a reference load are combined by a hybrid coupler, amplified in two independent amplifier chains, and separated out by another hybrid. The sky and the reference load power can then be measured and differenced. Since the reference signal has been subject to the same gain variations in the two amplifier chains as the sky signal, the true sky power can be recovered. The differencing receiver greatly improves the stability if the two input signals are almost equal, at a cost of a factor of in sensitivity compared to a perfectly stable total-power radiometer with the same noise temperature and bandwidth. This radiometer concept is capable of greatly reducing the knee frequency. We define as Radiometer Chain Assembly (RCA, see Figure 3) each functional unit from the feed horn to the BEM. The RAA therefore includes a set of 11 RCAs and the Data Acquisition Electronics, all mounted on a suitable mechanical structure (see also Figure 2 above). Although there are differences in the details of the radiometer chains at different frequencies, their overall configuration is similar, and a general description of its design is provided in this section. Planck LFI has 11 Radiometer Chain Assembly (RCA). Each RCA is constituted by feed horn and FEM in the FEU (at 20 K), BEM (at 300 K) in the BEU and four waveguides that connect each FEM-BEM couple. The frequency distribution of the RCA is the following:
- 2 RCAs at 30GHz
- 3 RCAs at 44GHz
- 6 RCAs at 70GHz
Radiometer Chain Assembly (RCA)[edit]
Every RCA consists of two radiometers, each feeding two diode detectors (see Figure 3 above), for a total of 44 detectors. The 11 RCAs are labelled by a numbers from 18 to 28 as outlined in Figure 1, right panel.
Figure 3 provides a more detailed description of each radiometric receiver. In each RCA, the two perpendicular linear polarisation components split by the OMT propagate through two independent pseudo-correlation differential radiometers, labelled as M or S depending on the arm of the OMT they are connected to (Main or Side, see lower-left inset of Figure 3).
In each radiometer the sky signal coming from the OMT output is continuously compared with a stable 4 K blackbody reference load mounted on the external shield of the HFI 4 K box #valenziano2009. After being summed by a first hybrid coupler, the two signals are amplified by ~30 dB, see upper-left inset of Figure 3. The amplifiers were selected for best operation at low drain voltages and for gain and phase match between paired radiometer legs, which is crucial for good balance. Each amplifier is labelled with codes 1, 2 so that the four outputs of the LNAs can be named with the sequence: M1, M2 (radiometer M) and S1, S2 (radiometer S). Tight mass and power constraints called for a simple design of the Data Acquisition Electronics (DAE) box so that power bias lines were divided into five common-grounded power groups with no bias voltage readouts; only the total drain current flowing through the front-end amplifiers is measured and is available to the house-keeping telemetry (this design has important implications for front-end bias tuning, which depends critically on the satellite electrical and thermal configuration and was repeated at all integration stages, during on-ground and in-flight satellite tests). A phase shift alternating between and at the frequency of 4096 Hz is applied in one of the two amplification chains and then a second hybrid coupler separates back the sky and reference load components that are further amplified and detected in the warm BEU, with a voltage output ranging from -2.5 V to +2.5 V.
Each radiometer has two output diodes which are labelled with binary codes 00, 01 (radiometer M) and 10, 11 (radiometer S), so that the four outputs of each radiometric chain can be named with the sequence: M-00, M-01, S-10, S-11.
After detection, an analog circuit in the DAE box removes a programmable offset in order to obtain a nearly null DC output voltage and a programmable gain is applied to increase the signal dynamics and optimally exploit the ADC input range. After the ADC, data are digitally down-sampled, re-quantised and compressed in the REBA according to a scheme described in #herreros2009, maris2009, before preparing telemetry packets. On ground, telemetry packets are converted to sky and reference load time ordered data after calibrating the ADU samples into volt considering the applied offset and gain factors.
To first order, the mean differential power output for each of the four receiver diodes can be written as follows #seiffert2002, mennella2003, bersanelli2010 [Planck pre-launch status: Design and description of the Low Frequency Instrument]:
where is the total gain, is the Boltzmann constant, the receiver bandwidth and is the diode constant. and are the average sky and reference load antenna temperatures at the inputs of the first hybrid and is the receiver noise temperature.
The gain modulation factor #mennella2003, planck2011-1-6 [Planck early results. The Low Frequency Instrument data processing], , is defined by:
and is used to balance (in software) the temperature offset between the sky and reference load signals and minimise the residual 1/ noise in the differential datastream. This parameter is calculated from the average uncalibrated total power data using the relationship:
where and are the average sky and reference voltages calculated in a defined time range. The white noise spectral density at the output of each diode is essentially independent from the reference-load absolute temperature and is given by:
If the front-end components are not perfectly balanced, then the separation of the sky and reference load signals after the second hybrid is not perfect and the outputs are mixed. First-order deviations in white noise sensitivity from the ideal behaviour are caused mainly by noise temperature and phase-switch amplitude mismatches. Following the notation used in #seiffert2002, we define , the imbalance in front end noise temperature, and and , the imbalance in signal attenuation in the two states of the phase switch. Equation above for the two diodes of a slightly imbalanced radiometer then becomes
which is identical for the two diodes apart from the sign of the term , representing the phase switch amplitude imbalance. This indicates that the isolation loss caused by this imbalance generates an anti-correlation between the white noise levels of the single-diode data streams. For this reason, the LFI scientific data streams are obtained by averaging the voltage outputs from the two diodes in each radiometer:
where and are inverse-variance weights calculated from the data as discussed in #planck2011-1-6. This way, the diode-diode anti-correlation is cancelled, and the radiometer white noise becomes
In Equations above, , while is a term given by:
See LFI data processing section for the details of the diode combination procedure.
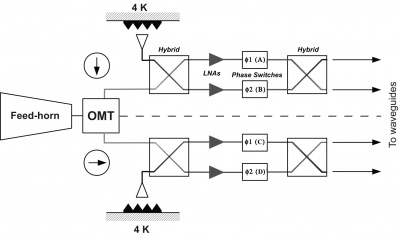
In Figure 4 below we show a close-up of the two front end modules of an RCA with the four phase switches which are labelled with the four letters A and B (main arm), C and D (side arm). Each phase switch is characterised by two states: state 0 (no phase shift applied to the incoming wave) and state 1 ( phase shift applied) and can either stay fixed in a state or switch at 4 kHz between the two states.
Phase switches are clocked and biased by the DAE and their configuration can be programmed via telecommand. In order to simplify the instrument electronics, phase switches are configured and operated in pairs: A/C and B/D. This means that if phase switches A and C are switching at 4 kHz then B and D are fixed both in the same state (either 0 or 1). This simplification, required during the design phase to comply with mass and power budgets, comes at the price of loosing some setup redundancy.
Feed Horns (FH)[edit]
Dual profiled corrugated horns have been selected at all LFI frequencies as the best design in terms of shape of the main lobe, level of the side lobes, control of the phase centre, and compactness. Dual profiled LFI horns are composed by a Sine Squared profiled section, and an exponential profile near the aperture plane. In order to optimise the optical matching of the feeds phase centres to the telescope focal surface, while preventing obscuration between horns, LFI has 6 different feed horn designs. For each frequency, the number of feeds and the number of different designs are reported in Table 1 below.
| Frequency (GHz) | Number of Horns | Number of designs |
|---|---|---|
| 30 | 2 | 1 |
| 44 | 3 | 2 |
| 70 | 6 | 3 |
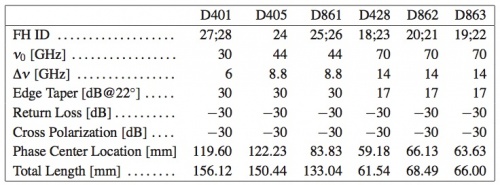
LFI feed horn design specifications are reported in the table 2 below.
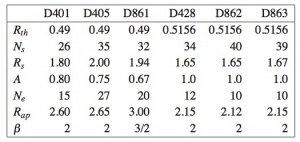
The design process led to a corrugation profile composed by a mixture of a sine-squared section, starting from the throat, and an exponential section near the aperture plane. The length of this last has a direct impact on the location of the phase center. The analytical expression of the corrugation profile, , is the following
in the sine section, and
in the exponential region. Here, is the throat radius, is the sine squared region end radius (or exponential region initial radius), is the aperture radius, is the sine squared region length and is the exponential region length. The parameter modulates the first region profile between linear and pure sine squared type. The parameters , and can be used to control, as far as possible, the position and frequency stability of the phase center and the compactness of the structure. The feed horn parameters are reported in table 3 below.
The qualification campaign, mainly focused on RF return loss and pattern (amplitude and phase) measurements, was successfully concluded. The agreement between the pattern measurements and the expected performances (simulated using nominal corrugation profile) is excellent both in amplitude and in phase. Moreover reflection measurements show a good impedance match for all the horns, the return loss being better than -30 dB over the whole 20% of operational bandwidth.
Details of the design, flight model and tests of Planck-LFI feed horns can be found in #villa2009.
OrthoMode Transducers (OMT)[edit]
The Ortho–Mode Transducer (OMTs) separates the two orthogonal polarisation components propagating inside the horn. The OMT is composed by the central square waveguide with two slots (the through and the side one, which separate and pick up the two polarisations), the waveguide transition between the two slots and the WR28 standard waveguide, the 90 degrees bend for the side port, the 90 degrees stepped twist for the through port waveguide transition between the square and the input circular waveguide of the horn. One polarisation propagates directly from the circular waveguide to the rectangular on–axis waveguide. A circular to rectangular stepped transition provides the interface with a WR28 standard waveguide, and the short for the other orthogonal polarisation. The second polarisation component propagates in the side arm.
The required and measured performances for the LFI OMTs at all frequencies are reported in the following tables 4 and 5:
| OMT ID | Bandwidth [GHz] | X–Pol [dB] (Main) | X–Pol [dB] (Side) | Return–Loss [dB] (Main) | Return–Loss [dB] (Side) |
|---|---|---|---|---|---|
| 18 | 14 | <29 | <30 | -15.0 | -18.0 |
| 19 | 14 | <26 | <28 | -15.0 | -18.0 |
| 20 | 14 | <32 | <35 | -15.0 | -18.0 |
| 21 | 14 | <32 | <37 | -15.0 | -18.0 |
| 22 | 14 | <26 | <28 | -15.0 | -18.0 |
| 23 | 14 | <26 | <28 | -15.0 | -18.0 |
| 24 | 8.8 | <38 | <40 | -13.0 | -15.0 |
| 25 | 8.8 | <31 | <32 | -13.0 | -15.0 |
| 26 | 8.8 | <27 | <25 | -13.0 | -15.0 |
| 27 | 6 | <38 | <44 | -16.0 | -24.0 |
| 28 | 6 | <36 | <38 | -16.0 | -24.0 |
The details of the flight models and measurements of the Planck LFI ortho-mode transducers can be found in #darcangelo2009b.
Front End Modules (FEM)[edit]
Front End Modules are located in the FPU, just in cascade of the Feed Horn and the Ortho Mode Transducers. 70 GHz FEMs are mounted onto the inner wall of the mainframe (the wall facing HFI instrument) from the HFI side. 44 and 30 GHz FEMs are inserted into the mainframe from the WG side and fixed to the bottom plate. Screws to bottom plate are inserted from WG side. The LFI FEMs are the first active stage of amplification of the radiometer chain. Each FEM contains four amplification paths. Each path is composed by several cascaded LNAs followed by a phase switch. Two passive hybrids, at the input and output of the FEM, are used to mix couples of signals of the same radiometer (see Figure 4). This makes the instabilities of each chain to be applied to both the sky and load signals.
The passive hybrid coupler (magic-tee) combines the signals from the sky and cold load with a fixed phase offset of either 90 deg or 180 deg between them. It has a 20% bandwidth, low loss, and amplitude balance needed at the output to ensure adequate signal isolation.
The FEM LNAs (InP MMIC) are biased providing 1 drain line per channel (that is 4 per FEM) and 2 gate lines per channel (that is 8 per FEM). The FEM Phase switches are biased providing 2 lines per channel (that is 8 per FEM) each capable of providing a direct bias current or a reverse bias voltage.
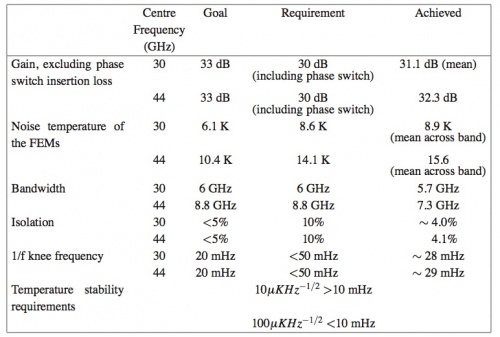
The LFI FEM parameters necessary to meet the science objectives at 30 and 44 GHz were given as requirements and goals and are summarised in table 6 below where they are compared with the values actually achieved. The FEM units meet the requirements, within the measurement errors, for most parameters and in particular the noise temperature. The units come close to the more stringent goals in several parameters. Of particular note are the noise temperatures achieved; these along with the wide bandwidths are critical for the high sensitivity required for the Planck mission. Some LNAs within the FEMs met the goals at 30 GHz and 44 GHz within the measurements errors and reached 3 and 5 times the theoretical quantum limit respectively at the band centres. Furthermore, a range of tests showed that LNAs and FEMs achieved the stability levels required to meet the observing strategy of Planck. In particular, the 1/f noise knee frequency ≤29 mHz, close to the goal, met the conditions imposed by the 60 second rotation period of the spacecraft. The linear polarization performance of the FEMs exceeded the requirements of the mission. The isolation between the E- and H- polarizations was measured to be between 51 and 58 dBs for the various FEMs. The LFI radiometers have very well determined position angle precision, being determined by the accuracy of the waveguide engineering. The 30 and 44 GHz geometry is accurate to ∼ ; the corresponding precision is ∼ in the HFI polarimeters. The temperature stability requirement values are also given in the table 6 below.
The details of the design, development and verification of the 30 and 44 GHz front-end modules for the Planck Low Frequency Instrument can be found in #davis2009.
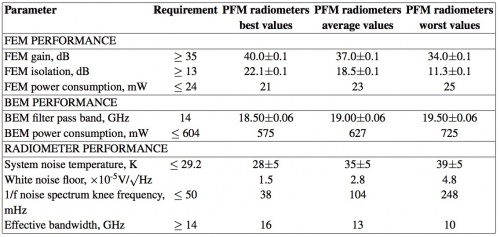
For what regards the 70 GHz channels, for the LNA selection of the FEMs, nine different wafers from various processing runs were evaluated, only the LNAs with the best performance were assembled as the first stage amplifiers in the FEM ACAs. For the phase switch selection, four different wafers were evaluated. When the signal is passed to an output, the gain is 35 dB or higher for almost the entire required range, and on average, the Planck requirement was fulfilled. In all FEMs, the average channel gains ranged from 34.0-40.0 dB (uncertainty ±0.1 dB). When the signal is isolated from an output, the gain is 20 dB lower or more at all frequencies. This difference in gain is used as the measure for isolation. In all the six FEMs, the channel isolation values ranged from 11.3-22.1 dB (uncertainty ±0.1 dB).
Table 7 below summarises the best, the worst and the average values of the key performance parameters. The shown uncertainties are based on worst case estimates.
The details of the design, development and verification of the 70 GHz front-end modules for the Planck Low Frequency Instrument can be found in #varis2009.
Waveguides[edit]
The LFI Front End Unit (FEU) (cooled at 20 K by the sorption cooler) is connected to the 300 K Back End Unit (BEU) by 44 rectangular waveguides approximately 2.0 meter long. Each waveguide exhibits low VSWR, low thermal conductivity, low insertion loss, and low mass. In addition, the waveguide path shall permit the LFI/HFI integration and the electrical bonding between FPU and BEU. Because of the Focal Plane Unit arrangement, the waveguides are in general twisted and bended in different planes and with different angles, depending on the particular waveguide. In Figure 1 (left panel) a conceptual sketch of the LFI configuration is shown.
All the required characteristics cannot be realised with single material waveguide configuration; a composite waveguide configuration is needed. The WGs can be considered divided in three sections corresponding to different materials used for the waveguide manufacturing: 1. a 400 mm of Stainless Steel (gold plated) straight waveguide section is attached to the BEU and ends after the 3rd V–groove; 2. a 300 mm of non–plated Stainless Steel (SS) section provides a thermal break between the 50K groove and 20K stage, SS-sections are identical for all the channels except for the cross dimensions that define the cut-off frequency; 3. a bended and twisted 400 microns thin electroformed copper waveguide starts at the end of the SS–section and is attached to the FEU, its length varying from 930 mm to 1750 mm, with 2 to 4 Cu-joints. The copper waveguides section is connected to a mechanical support structure in five points in order to increase the stiffness of the waveguide.
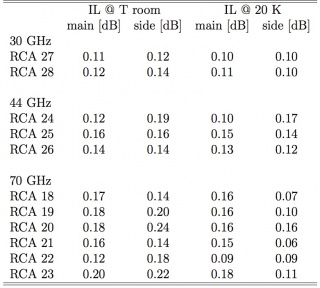
The performance for the LFI waveguides at all frequencies are reported in the following table:
| Frequency | Type | Number | IL [dB] | RL [dB] | R [mΩ] @20 K | R [mΩ] @300 K |
|---|---|---|---|---|---|---|
| 30 | WR28 | 8 | 2.0 (1.0) | ≤ −20 | 11.8 | 27.3 |
| 44 | WR22 | 12 | 3.0 (1.5) | ≤ −20 | 14.7 | 34.1 |
| 70 | WR12 | 24 | 4.0 (3.5) | ≤ −20 | 26.2 | 60.5 |
From the thermal point of view the waveguides have to connect 2 systems (BEM and FEM) that are at different temperatures. At BEM level the waveguides are at a temperature of 300K while at FEM level the temperature is 20K. Along the Stainless Steel section the waveguides have to reduce the thermal flow from 300K to 20K. The Stainless Steel waveguide is connected to all the V-grooves in order to dissipate the heat produced at BEU level.
Details of the Planck-LFI flight model of the composite waveguides can be found in #darcangelo2009a.
Back End Modules (BEM)[edit]
The BEMs are composed by four identical channels each made of Low Noise Amplifiers (LNA), RF Band Pass Filter, RF to DC diode detector and DC amplifiers.
In the 30 GHz BEM, each LNA consists of two cascaded MMIC amplifiers. The Band Pass Filter is based on microstrip coupled line structure. Its design is a three order Chebyshev response band pass filter. The detector is composed by a hybrid reactive/passive matching network, and a Schottky diode. A commercial Agilent beam-lead and zero-bias diode was selected. The detector diode is followed by a low noise operational amplifier that provides most of the DC amplification. A second stage is implemented using an operational amplifier to provide a balanced bipolar output.
In the 44 GHz BEM, each LNA consists of self designed MMIC amplifiers manufactured with the process ED02AH from OMMIC which employs a 0.2 μm gate length Pseudomorphic-High Mobility Transistor (P-HEMT) on GaAs. The topology chosen for the band-pass filter is a third order Chebyshef band pass filter made on a PTFE substrate (height=0.254mm, ε=2.17), based on microstrip coupled line structure. The detector is composed by a hybrid reactive/passive matching network and a Schottky diode. A commercial Agilent beam-lead and zero-bias diode was selected. The detector diode is followed by a low noise operational amplifier that provides most of the DC amplification. A second stage is implemented using an operational amplifier to provide a balanced bipolar output.
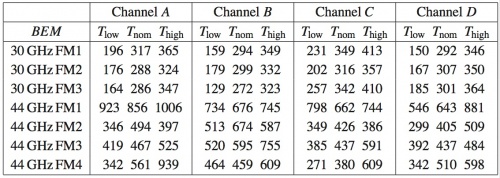
Table 9 below shows the values of the equivalent noise temperature for each flight model BEM at three different temperatures in the range of possible operating temperature. The large variability of the equivalent noise temperature of 44 GHz BEM units was due to their large dependence on the input matching network result, which was observed to be a very critical parameter, not easy to control during the assembly process of MMIC.
The raw measurements of the output spectrum are used for the determination of the 1/f knee frequency. The results for the four channels of a 30 GHz BEM unit are given in the table below.
The details of the design, development and verification of the 30 and 44 GHz back-end modules for the Planck Low Frequency Instrument can be found in #artal2009.
The 70 GHz BEM is constructed of machined aluminium with separate filter, amplifier/detector assemblies and an overall housing for other circuits and components. The FEM output signals are connected by waveguide from the Focal Plane Unit (FPU) assembly to the Back End Modules (BEM’s) housed adjacent to, the Data Acquisition Electronics (DAE) assembly. To maintain compatibility with the FEM’s, each BEM will accommodate, four receiver channels, from the four, waveguide outputs of each FEM. The BEM internal signal routes are not cross coupled and can be regarded as four identical parallel circuits. Each BEM is constructed as two mirror halves. The two amplifier/detector assemblies each contain two amplifier/detector circuits. Each is supplied from one of a pair of printed circuit boards which also house two DC output amplifiers.
The BEM filter characteristics hold very accurately for every channel in the six BEMs. The -3 dB pass band, 62-81 GHz, was the same in every filter within 0.5 GHz. The BEM frequency response was measured as a function of input microwave power. Also, the pass bands roll at almost exactly 63 GHz and 77 GHz. The linearity of the channel is very good as well, especially from -57 dBm upwards. The dynamic range was at least 15 dB from -57 dBm to -42 dBm. In three cases, the BEMs fulfilled the power consumption requirement, while the limit was exceeded for the other three. For the total six BEMs, the limit, 3.6 W, was exceeded by approximately 140 mW. Table 7 above summarises the best, the worst and the average values of the key performance parameters. The shown uncertainties are based on worst case estimates.
The details of the design, development and verification of the 70 GHz back-end modules for the Planck Low Frequency Instrument can be found in #varis2009.
4K Load[edit]
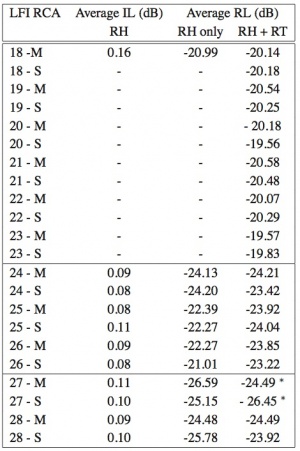
The purpose of the 4 K reference load is to provide the radiometer with a stable reference signal. Reducing the input offset (the radiometric temperature difference between the sky and the reference load) reduces the minimum achievable radiometer 1/f noise knee frequency for a given amplifier fluctuation spectrum. A reference load temperature that matches the sky temperature (approximately 2.7 K) would be ideal. In the 4KRL design, the reference temperature is provided by the HFI outer radiation shield, at a temperature around 4K. The 4KRL performance are reported in Table 11 below.
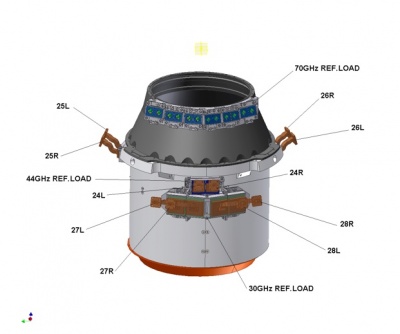
The 4K reference load unit is formed by single targets, one for each radiometer (two for each FEM). The horns used to couple to the 4 K reference load targets need to be relatively small because the targets themselves are small. An optimisation process produced a different horn design for each LFI band: their dimensions increase with reducing frequency. Due to the LFI Focal Plane design, where higher frequency radiometers (70 GHz) are placed around the HFI cryostat and the lower frequency radiometers (30 and 44 GHz) in a second row, the target mounting structure is separated in two parts, see Figure 5 below. The upper one is located around the conical part of the HFI outer shield. Reference targets are mounted on a supporting structure, thermally and mechanically connected to the HFI outer shield. Each target faces a reference horn, two for each FEM. This ensemble is fixed to a support structure on the HFI 4K shield. Thermal link between the mounting structure and the HFI is obtained via fixation point only. Thermal washers are interposed to damp temperature fluctuations on targets induced by the HFI outer shield temperature oscillations. The lower part is fixed in the cylindrical part. It is made with the same target geometry of the upper part, and it is fixed on the HFI shield. The reference horns face the loads and are connected to the FEMs through WGs. Reference WGs and RH (Reference Horns) are either included in the FEM (70 GHz) or external to FEM (30 and 44 GHz).
Targets are formed of a back section, made of ECCOSORB CR117, which shows higher RF absorption but also high reflectivity. To reduce the target global reflectivity, a front section, assembled with an ECCOSORB specific cement to the back one, faces the radiometer Reference Horn. This last is casted from ECCOSORB CR110, whose RF reflectivity is lower than that of CR117. Target design is optimised to further reduce both reflectivity and leakage. Each target is metal backed and it is mounted in a metal enclosure.
Thermal tests were performed in the IASF-Bo 4K cryo facility, equipped with a GM cooler, with an heat lift up to 1.5 W at 4K. The setup simulated the real environment in the payload, where targets are mounted on the HFI 4K shield in front of the quasi-cylindrical LFI main frame at about 20 K. It was also used to test the susceptibility to fluctuations of the LFI.
The thermo-mechanical damping was evaluated from the transient test, inducing sinusoidal temperature fluctuation with periods of 60, 600, 667 (typical Sorption Cooler period) and 1000 seconds at the level of the attachment point of the loads on the support structures. The fluctuation at the level of the targets is then acquired and the transfer function (amplitude and phase) are estimated by the ratio of the amplitudes. The final results are summarized in the table 12.
LFI Naming Convention[edit]
The naming of all the LFI elements is described in the previous sections but here is summarized again for clarity.
The 11 RCAs are labelled by a numbers from 18 to 28 as outlined in Figure 1, right panel. In each RCA, the two perpendicular linear polarisation components are labelled as M or S according to the arm of the OMT they are connected to (Main or Side, see lower-left inset of Figure 3).
Each front-end amplifier (see upper-left inset of Figure 3) is labelled with codes 1, 2 so that the four outputs of the LNAs can be named with the sequence: M1, M2 (radiometer M) and S1, S2 (radiometer S).
Each radiometer has two output diodes which are labelled with binary codes 00, 01 (radiometer M) and 10, 11 (radiometer S), so that the four outputs of each radiometric chain can be named with the sequence: M-00, M-01, S-10, S-11.
REBA[edit]
The Radiometer Electronics Box Assembly (REBA) is the electronic box in charge of processing the digitized scientific data and to manage the overall instrument. It is also in charge of the communication with the spacecraft. There are two REBA boxes, one nominal and one redundant. The redundancy concept is cold, which means that both boxes are never ON at the same time; the operation of each unit shall be managed by the spacecraft switching-on the corresponding unit. The REBA ASW (Application SoftWare) is the same in each REBA box.
Each REBA consists of the following subunits:
- The Power Supply Unit (PSU) which feeds the REBA unit. It consists of a DC/DC converter that converts the primary power received from the spacecraft PDU to the secondary regulated voltages required only by the REBA and provides galvanic isolation towards the spacecraft side of the interface. The PSU DC/DC converter also receives the On-Board Clock (OBC) from the CDMS that is used to increment the internal On Board Time register. There is no software interface with the REBA ASW.
- The Data Acquisition Unit (DAU) performs the analogue to digital conversion of the analogue housekeeping data of the REBA itself (temperatures and voltages). The REBA ASW collects from the DAU the HK data.
- The Signal Processing Unit (SPU) is a computing subunit in charge of the reduction and compression of the science data and implements part of the REBA ASW, the SPU ASW (stored in the EEPROM located in the DPU board and transferred to the SPU by the DPU ASW). It receives the science data from the DAE through a IEEE 1355 link implemented in a SMCS chip. A second IEEE 1355 link is used to control by link the remote DAE SMCS chip. The third IEEE 1355 link communicates with the DPU. A “Data Ready” electrical signal is connected between DAE and the SPU, this signal produces an interruption in the SPU when the DAE is ready to transfer data.
- The Digital Processing Unit (DPU) is a computing subunit and implements part of the REBA ASW, the DPU ASW. The DPU is in charge of the control and monitoring of the instrument as well as the communication with the spacecraft (CDMS). It contains another SMCS chip with 3 IEEE 1355 links that communicate with the SPU, and the DAE. A MIL-STD 1553B link is used to communicate with the CDMS. One IEEE 1355 link is used by the DPU ASW to communicate with the DAE to control by link the SMCS chip of DAE, the second one is used to communicate with the DAE to transfer commands and HK and the third one is used by DPU ASW to communicate with the SPU (commands and TM). Two Reset electrical lines are provided by the DPU to reset each of the two SMCS chips of DAE. The DPU ASW is stored in the EEPROM.
A detailed description of the Planck LFI REBA can be found in #herreros2009.
Instrument On-board Software[edit]
The REBA software is the on board software of LFI. It is installed in the two computing subunits of REBA: the DPU, responsible of the control and monitoring of the instrument and the interface with the spacecraft and; the SPU, responsible of the data reduction and compression. The REBA software can be classified (see Figure 6) into:
- 1. the REBA Start-up Software (SUSW), installed in the PROM memories, which is the bootstrap code to switch on both the subunits;
- 2. the Application Software (ASW), which performs the nominal operations of the REBA;
- 3. the REBA Low Level Software Drivers (LLSWDRV) which are functions provided to the ASW to access the hardware capabilities.
The SPU SUSW and DPU SUSW, located in the PROM memories of SPU and DPU, respectively, are in charge of the booting of the subunits.
The REBA ASW performs the following main functions:
- SPU ASW reduction and compression of the scientific data;
- DPU ASW: control and monitoring of the instrument, interface with the spacecraft to transfer data and receive commands to/from ground, communication with the SPU SUSW during the start-up procedure to load the SPU ASW.
The REBA ASW checks periodically the following parameters:
- − Science TM rate produced on board in order to control the filling of the spacecraft mass memory;
- − CPU load of the SPU;
- − Focal Plane temperature sensors;
- − The communication links between REBA and DAE.
In case of deviations from nominal values, the REBA ASW activates autonomy functions that put the instrument in a safe state or recover from non-nominal situations. Autonomy functions allows to:
- - Re-enable, in some cases, previously disabled science processing;
- - Switch-off the Front End Unit by sending Disable RCA DC/DC commands to the DAE;
- - Try to resume the communication between REBA and DAE or ask the CDMS to switch off the RAA.
The DPU ASW reports the activation of any autonomous function by sending to the CDMS an event report. The REBA monitors some LFI HK parameters in order to manage to some extent the safety of the instrument.
Reduction and Compression of Science Data[edit]
To asses stability against 1/f noise, the Low Frequency Instrument (LFI) on-board the Planck mission will acquire data at a rate much higher than the data rate allowed by the science telemetry bandwidth of 35.5 kbps. The data are processed by an on-board pipeline, followed on-ground by a decoding and reconstruction step, to reduce the volume of data to a level compatible with the bandwidth while minimizing the loss of information. The on-board processing of the scientific data used by Planck/LFI to fit the allowed data-rate is an intrinsically lossy process which distorts the signal in a manner which depends on a set of five free parameters () for each of the 44 LFI detectors. Here we briefly describe the characteristics of this algorithm and the level of distortion introduced by the on-board processing as a function of these parameters. A full description of the Planck LFI on-board data handling system and the tuning and optimization method of the on-board processing chain can be found in #maris2009.
The strategy adopted to fit into the bandwidth relies on three on-board processing steps: downsampling, pre-processing the data to ensure loss-less compression, and loss-less compression itself. To demonstrate these steps, a model of the input signal shall be used. It has to be noted that while the compression is loss-less, the pre-processing is not, due to the need to rescale the data and convert them in integers, (a process named data re-quantizzation). However, the whole strategy is designed to asses a strict control of the way in which lossy operations are done, of the amount of information loss in order to asses optimal compression rate with minimal information loss.
A schematic representation of the sequence in which these steps are applied on-board and whenever possible reversed on-ground is given in figure 7 below.

The figure refers to a single radiometer chain and is ideally splitted into two parts: the upper part depicts the on-board processing with cyan boxes denoting the main steps. The corresponding on-ground processing is depicted in the lower part with the main steps colored in yellow. Green pads represents the processing parameters. The first four of them are referred to as REBA parameters, and they are applied both on-board and on-ground. The parameters are: the number of ADC raw samples to be coadded to form an instrumental sample, , the two mixing parameters , the offset to be added to data after mixing and prior to re-quantization, and the re-quantization step . It is important to note that the on-board parameters are set by telecommands and are stamped in each scientific packet. The gain modulation factor, (see RCA description above), is a parameter of the ground processing and is computed from the total power data received on ground. The final products in the form of Time Ordered Data (TOI) either in total power or differentiated are stored in an archive represented by the light-blue cylinder.
All the needed optimization steps are performed by an automated software tool, the Onboard Computing Analysis (OCA), which simulates the on-board processing, explores the space of possible combinations of parameters, and produces a set of statistical indicators, among them: the compression rate and the processing noise . For Planck/LFI it is required that while, as for other systematics, would have to be less than 10% of rms of the instrumental white noise. An analytical model is developed that is able to extract most of the relevant information on the processing errors and the compression rate as a function of the signal statistics and the processing parameters to be tuned. This model is of interest for the instrument data analysis to asses the level of signal distortion introduced in the data by the on-board processing.
The tuning process is applied once the instrument is completed tuned and stable. The procedure foresees to acquire chunks of about 15 minutes of averaged data to be analyzed by OCA to optimize the REBA parameters. After setting the REBA parameters another session of 15 minutes of acquisition, this time with the nominal processing.
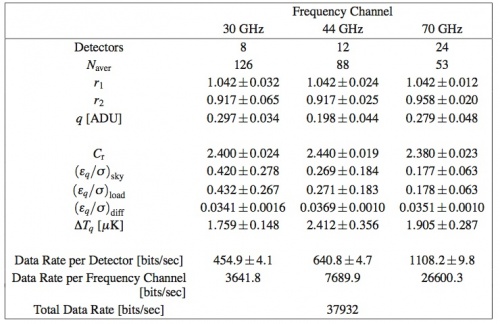
The values for the optimal REBA parameters are mainly determined by the frequency of the radiometric channel with some dispersion from detector to detector. Table 13 below gives representative median values for from on ground System Level tests (CSL) as well as for the quantities in figure 8 below and the resulting data rate. is omitted since it is the most variable parameter and it has no significant impact on and . Table 13 below reports also the number of detectors for each frequency channel, the values which are kept constant, the compressed data rate per detector, per frequency channel and for the instrument as a whole. Quantities are reported in the form where represents the standard deviation taken as a measure of the internal dispersion of within the given subset of detectors, this number must not be interpreted as an error and it must not be propagated.
The performance has been verified against the requirements with the result that the required data rate of 35.5 kbps has been achieved while keeping the processing error at a level of 3.8% of the instrumental white noise and well below the target 10% level.

In flight the procedure is to acquire continuously data by using the nominal processing. Short chunks of unprocessed data is daily acquired in turn from each detector. The comparison of unprocessed with processed data allows to monitor of the processing error. In addition the REBA tuning might be repeated daily on the chunk of unprocessed data in order to test whether some REBA parameters on-board the satellite should be changed or not.
Instrument Operations[edit]
LFI Operational Modes[edit]
The operations of the LFI are designed to be automatic and require little if any intervention from the ground. A small amount of commands is required for operating the instrument and eventually for diagnostic and reconfiguration purposes. Each sky survey is conducted by the LFI with the instrument in the Normal Operations Mode mode. No deployable elements, or mechanically moving parts are included in the instrument. The scanning of the sky is achieved by progressive repointing of the satellite spin axis, with the Sun direction always within a cone 10 degrees from the spin axis. Within the Normal Science Mode the instrument can be configured in order to fit with different science or diagnostic needs without changing the power consumption and thus the temperature in the FPU. Changes in power consumption in the FPU are minimised and should occur only in the case that failures in the radiometers that could create interference problems require an RCA to be switched off. Power adjustments on the first stage of the HEMT amplifiers which are contemplated, require extremely small power level variations.
A scheme of the nominal transitions between the LFI Operation Modes are shown in Figure 9, a brief summary is given below.
- 1. OFF MODE: During this operating mode the instrument is completely off for example during the launch.
- 2. STAND-BY: During this mode only the REBA can be operated. It is the first interface to the instrument whenever the LFI is switched on. When the instrument is in this mode the RAA must be OFF because no data can be received and no control is possible on the radiometer chains.
- 3. DAE SET-UP: During this mode the REBA and the DAE are ON, but no radiometer chains are active. Nevertheless science data can be generated and contain only the background noise of the instrument.
- 4. NORMAL SCIENCE: During this mode the RAA is seen by the REBA as a set of 44 independent instruments. This means that each instrument can be operated, by the same SW, in different modes without affecting the LFI modes. Science data from the DAE are continuously acquired by the REBA that decides, on the basis of the activation table, which packets (either science or diagnostic) have to be produced. The whole set of HK is continuously acquired and sent to ground. This mode is the nominal for the LFI observation operations.
- 5. EXTENDED SCIENCE: This mode is similar to the previous except that for the total amount of telemetry sent to the ground. In fact this mode shall be used when, in particular cases, (e.g. calibration…) a larger telemetry rate is needed and made available by an agreement with HFI and the CDMS.
During launch, for contingency situations and/or to allow diagnostics of other spacecraft subsystems (e.g. HFI or others) LFI is in the OFF mode. When, upon a command from ground the REBA is powered on, the instrument is in its STAND-BY mode. A step-by-step bootstrap procedure commanded from ground documented by HK is initialized to turn the DAE on. This sets-up the internal communications, and allows the LFI subsystems to collect and deliver a full set of HK. The instrument is in DAE SET-UP mode. The following step is to upload from ground the DAE settings and processing parameters; then, to switch on the RCA on ground command. At this stage, on ground command, the acquisition of science data can start. A further step is needed to move to NORMAL SCIENCE, namely start processing and compressing the science raw data. When this is accomplished, science packets can be sent to ground.
In-flight Operations[edit]
TBW
Anomalies[edit]
TBW
LFI Ground Tests[edit]
During its development, the LFI flight model was calibrated and tested at various integration levels from sub-systems #davis2009 to individual integrated receivers #villa2010 [[Planck pre-launch status: Calibration of the Low Frequency Instrument flight model radiometers] and the whole receiver array #mennella2010 [Planck pre-launch status: Low Frequency Instrument calibration and expected scientific performance]. In every campaign we performed tests according to the following classification:
- Functionality tests, performed to verify the instrument functionality.
- Tuning tests, to tune radiometer parameters (biases, DC electronics gain and offset, digital quantisation and compression) for optimal performance in flight-like thermal conditions.
- Basic calibration and noise performance tests, to characterise instrument performance (photometric calibration, isolation, linearity, noise and stability) in tuned conditions.
- Susceptibility tests, to characterise instrument susceptibility to thermal and electrical variations.
Where possible, the same tests were repeated in several test campaigns, in order to ensure enough redundancy and confidence in the instrument behaviour repeatability. A matrix showing the instrument parameters measured in the various test campaigns is provided in Table 1 of #mennella2010 [Planck pre-launch status: Low Frequency Instrument calibration and expected scientific performance].
The ground test campaign was developed in three main phases: cryogenic tests on the individual RCAs, cryogenic tests on the integrated receiver array (the so-called radiometer array assembly, RAA) and system-level tests after the integration of the LFI and HFI instruments onto the satellite. The first two phases were carried out at the Thales Alenia Space - Italia laboratories located in Vimodrone (Milano, Italy) (note that receiver tests on 70 GHz RCAs were carried out in Finlad, at Yilinen laboratories), system level tests (SLT) were conducted in a dedicated cryofacility at the Centre Spatiale de Liege (CSL) located in Liege (Belgium).
In Table 14 below we list the temperature of the main cold thermal stages during ground tests compared to in-flight nominal values. These values show that system-level tests were conducted in conditions that were as much as possible flight-representative, while results obtained during RCA and RAA tests needed to be extrapolated to flight conditions to allow comparison. Details about the RCA test campaign are discussed in #villa2010 [Planck pre-launch status: Calibration of the Low Frequency Instrument flight model radiometers] while the RAA tests and the extrapolation methods are presented in #mennella2010 [Planck pre-launch status: Low Frequency Instrument calibration and expected scientific performance].
| Temperature | Nominal | RCA tests | RAA tests | System-level |
|---|---|---|---|---|
| Sky | ~ 3 K | ≳ 8 K | ≳ 18.5 K | ~ 4 K |
| Ref. load | ~ 4.5 K | ≳ 8 K | ≳ 18.5 K | ~ 4.5 K |
| Front-end unit | ~ 20 K | ~ 20 K | ~ 26 K | ~ 20 K |
Cryogenic system-level tests were split into three parts:
- 1. Thermal balance, to validate the overall thermal mathematical model. The ground vacuum test equipment simulated the space environment.
- 2. System cryogenic test, to check and optimise the satellite and instrument performance working at nominal temperatures.
- 3. Thermal cycling test, to check the reliability of all electronics equipment and instruments to temperature variations (note that to allow the thermal control of the Service Vehicle Module (SVM), the warm part of the spacecraft was surrounded by a cryogenic shroud at a temperature lower than 100 K. The temperature of the shrouds was adjustable in order to allow the thermal cycling of the SVM during the tests. The temperature ranged between the two extreme values of C to C).
During the various test campaigns the instrument was switched off and moved several times in a time period of about three years. A series of functional tests were always repeated at each location and also in flight, in order to verify the instrument functionality and the response repeatability. No failures or major problems have been identified due to transport and integration procedures.
TBW
LFI In-flight Calibration[edit]
The Planck cryo-chain #planck2011-1-3 [Planck early results. The thermal performance of Planck] is composed by three coolers: a 20 K Hydrogen sorption cooler, which is passively pre-cooled by the V-groove radiator, cools the LFI focal plane and pre-cools the HFI 4K cooler; a Stirling 4K cooler that cools the HFI box and feed-horns and provides a 4K blackbody reference signal to the LFI receivers; a 0.1 K dilution cooler, which is pre-cooled by the 4K cooler and cools the HFI bolometer filters to K and the HFI bolometer detectors to ~0.1 K. The cooldown of the HFI 4K stage, in particular, was key during CPV for the LFI as it provided a variable input signal that was exploited during bias tuning.
The LFI CPV started on June, 2009 and lasted until August, when Planck started scanning the sky in nominal mode. At the onset of CPV, the active cooling started when the radiating surfaces on the payload module reached their working temperatures (~50 K on the V-groove, and ~40 K on the reflectors) by passive cooling. This was achieved during the transfer phase. Nominal temperatures were achieved on July, 2009, when the dilution cooler temperature reached 0.1 K #planck2011-1-3, meinhold2009 [Planck early results. The thermal performance of Planck] (see Figure 5 below).
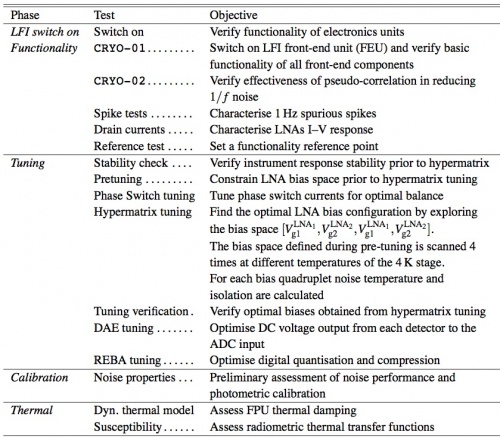
The CPV was carried out in four phases (see Table 15 below for a summary of the overall CPV test campaign):
- LFI switch on and basic functionality verification,
- Tuning of front-end biases and back-end electronics,
- Preliminary calibration tests,
- Thermal tests.
TBW
LFI Performance[edit]
Instrument Scientific Performance[edit]
TBW
Instrument Technical Performance[edit]
TBW
Spectral Response[edit]
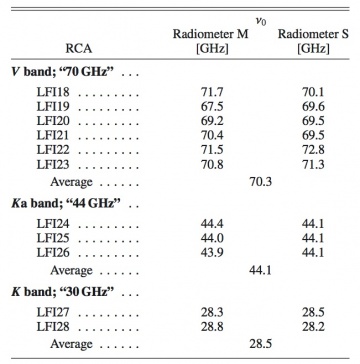
The in-band receiver response has been thoroughly modelled and measured for all the LFI detectors during ground tests. The complete set of bandpass curves has been published in #zonca2009. From each curve we have derived the effective centre frequency according to
where is the receiver bandwidth and is the bandpass response. Table 16 below gives the centre frequencies of the 22 LFI radiometers. For each radiometer, is calculated by weight-averaging the bandpass response of the two individual diodes with the same weights used to average detector timestreams. For simplicity and for historical reasons, we will continue to refer to the three channels as the 30, 44, and 70 GHz channels.
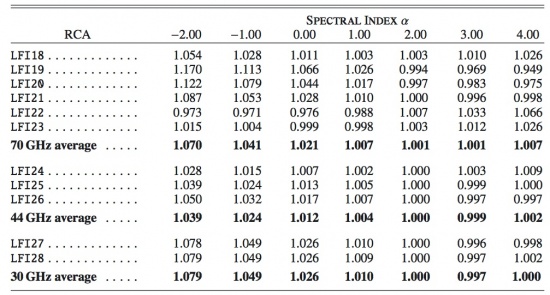
Colour corrections, , needed to derive the brightness temperature of a source with a power-law spectral index , are given in the table 17 below. The values are averaged for the 11 RCAs and for the three frequency channels. Details about the definition of colour corrections are provided in #planck2011-1-6.
Bandpass Estimation[edit]
As detailed in #zonca2009, our most accurate method to measure the LFI bandpasses is based on measurements of individual components integrated into the LFI Advanced RF Model (LARFM) to yield a synthesised radiometer bandpass. The LARFM is a software tool based on the Advanced Design System (ADS) circuit simulator by Agilent. The measured frequency responses of the various subsystems (feed-OMT, FEM, BEM) are considered as lumped S-parameter components. Measurements of single components are obtained with standard methods, typically employing a VNA test set, and provide highly reliable results, with precision of order 0.1-0.2 dB over the entire band. Waveguides are simulated with an analytical model, in order to reproduce the effect of their temperature gradient and the effect of standing waves caused by impedance mismatch at the interfaces between the FEM and BEM. This is because the 1.8-meter long waveguides were not measured at unit level in cryogenic conditions. The model provides accurate agreement with the measured waveguide response in the conditions of the test measurements (300 K). The composite bandpasses are estimated to have a precision of about 1.5 to 2 dB.
We also attempted an end-to-end measurement of the RCA spectral response in the cryofacility as an independent check. Unfortunately, these measurements suffered some subtle systematic effects in the test setup (standing waves at 70 GHz; polarisation mismatch and low frequency coverage at 30 and 44 GHz), preventing an accurate cross-check. However, the comparison shows a general agreement within limits of the test reliability and repeatability.
Figures 11 and 12 below show all the LFI bandpasses obtained by the frequency response data of each radiometer unit assembled by the LARFM. The 70 GHz channels show a low bandpass ripple, of about 10 dB, which is within scientific requirements. The spike between 60 and 61 GHz, below the low frequency cut-off, is due to a systematic effect present in all the BEM gain measurements and caused by the test setup. We removed this range from the bandpasses made available at the Data Processing Center in order to avoid possible spurious effects and therefore the frequency coverage is 61-80 GHz. The high frequency cut-off is not well defined in most of the channels. The 30 and 44 GHz bandpasses show a more complex shape, driven by the BEM spectral response, but still within dB. The low frequency cut-off is always well defined, while the high frequency cut-off is not well defined in RCA 24 and 26. However, comparing with the high frequency cut-off of RCA 25, it is expected that the additional bandwidth is very low. Frequency coverage is 25-50 GHz for the 44 GHz channels and 21.3-40 GHz for the 30 GHz channels.
Sensitivity[edit]
As reported in #planck2011-1-4 [Planck early results. First assessment of the Low Frequency Instrument in-flight performance], figure 13 compares the calibrated white noise sensitivity for the 22 LFI radiometers calculated from flight data and during ground tests performed both at instrument and satellite level. Error bars reported for values measured in flight and during satellite tests are statistical uncertainties derived from calculations performed on about 20 one-hour blocks of on-ground satellite data and one year of in-flight data. Error bars reported for values measured at instrument level, instead, represent the uncertainty between two different methods used to extrapolate the white noise sensitivity measured at test conditions (∼20 K input and ∼26 K front-end temperature) to flight conditions (∼2 K input and ∼20 K front-end temperature). Figure 13 shows general agreement in the sensitivity calculated in various test campaigns, with two outstanding exceptions, radiometers LFI24M and LFI21S, which show significantly improved noise levels in-flight. This resulted from an incorrect bias setting of these radiometers during ground tests, which was resolved during in-flight tuning. In figure 13 values for LFI18M and LFI24M measured at instrument-level are not reported because these two radiometers failed. LFI18M was replaced with a spare unit and LFI24M was repaired before instrument delivery.
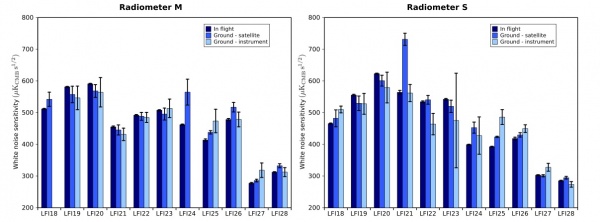
Table 18 summarizes the sensitivity numbers calculated during the first year of operations using methods and procedures described in detail in #planck2011-1-6 [Planck early results. The Low Frequency Instrument data processing], compared with scientific requirements. The measured sensitivity is in very good agreement with pre-launch expectations. While the white noise moderately exceeds the design specification, this performance is fully in line with the LFI science objectives.
Stability[edit]
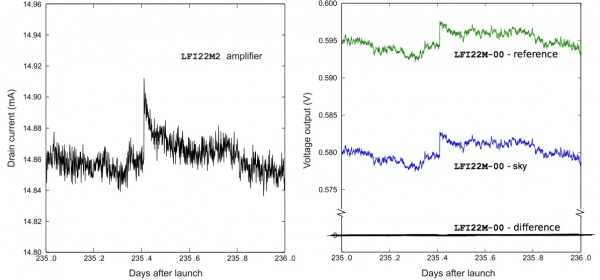
Thanks to its differential scheme, the LFI is insensitive to many effects caused by 1/f noise, thermal fluctuations, or electrical instabilities. As detailed in #planck2011-1-4 [Planck early results. First assessment of the Low Frequency Instrument in-flight performance], one effect detected during the first survey was the daily temperature fluctuation in the back-end unit induced by the downlink transponder, which was powered on each day for downlinks during the first 258 days of the mission. As expected, the effect is highly correlated between the sky and reference load signals. In the difference, the variation is reduced by a factor , where is the gain modulation factor defined above. A particular class of signal fluctuations occasionally observed during operations is due to electrical instabilities that appear as abrupt increases in the measured drain current of the front-end amplifiers, with a relaxation time variable from few seconds to some hundreds of seconds. Typically, these events cause a simultaneous change in the sky and reference load signals. Because they are essentially common-mode, their residual on the differenced data is negligible (figure 14), and the data are suitable for science production. In a few cases the residual fluctuation in the differential output was large enough (a few millikelvin in calibrated antenna temperature units) to be flagged, and the data were not used. The total amount of discarded data for all LFI channels until Operational Day 389 was about 2000 s per detector, or 0.008%. A further peculiar effect appeared in the 44 GHz detectors, where single isolated samples, either on the sky or the reference voltage output, were far from the rest. Over a reference period of four months, 15 occurrences of single-sample spikes (out of 24 total anomaly events) were discarded, an insignificant loss of data.
Instrument Budgets[edit]
Power Consumption[edit]
TBW
Mass Budget[edit]
TBW
Telemetry Budget[edit]
TBW
LFI Systematics Effects[edit]
The LFI design was driven by the need to suppress systematic effects well below instrument white noise. The differential receiver scheme, with reference loads cooled to 4 K, greatly minimises the effect of 1/f noise and common-mode fluctuations, such as thermal perturbations in the 20K LFI focal plane. The use of a gain modulation factor (see Eq. (xx)) largely compensates for spurious contributions from input offsets. Furthermore, diode averaging (Eq. (xx)) allows us to cancel second-order correlations such as those originating from phase switch imbalances. We have developed an error budget for systematic effects (#planck2011-1-4, bersanelli2010 [Planck early results. First assessment of the Low Frequency Instrument in-flight performance],Planck pre-launch status: Design and description of the Low Frequency Instrument]) as a reference for both instrument design and data analysis. Our goal is to ensure that each systematic effect is rejected to the specified level, either by design or by robust removal in software. At this stage, the following effects are relevant:
- – 1/ f noise;
- – 1Hz frequency spikes;
- – thermal fluctuations in the back-end modules driven by temperature oscillations from the transponder during the first survey;
- – thermal fluctuations in the 20 K focal plane;
- – thermal fluctuations of the 4 K reference loads.
For each of these effects we used flight data and information from ground tests to build timelines, maps, and angular power spectra that represent our best knowledge of their impact on the scientific analysis. The details of the systematic effect analysis is given in section xxxx.
Acronyms[edit]
- BEM Back End Module
- BEU Back End Unit
- CCE Central Check-out Equipment
- CDMS Command and Data Management Subsystem
- CDMU Central Data Management Unit
- CoG Centre of Gravity
- DAE Data Acquisition Electronics
- DC Direct Current
- DPC Data Processing Centre
- EMC Electro-Magnetic Compatibility
- EMI Electro-Magnetic Interference
- FEM Front End Module
- FEU Front End Unit
- FH Feed Horn
- FOV Field Of View
- FPU Focal Plane Unit
- HK House Keeping
- ILT Instrument Level Test
- IST Integrated System Test
- JFET Junction Field Effect Transistor
- LEOP Launch and Early Orbit Phase
- MLI Multilayer Insulation
- MoI Moment of Inertia
- MOS Margin Of Safety
- OMT Ortho Module Transducer
- PCS Power Control Subsystem
- PSF Point Spread Function
- RAA Radiometer Array Assembly
- RAM Random Access Memory
- RCA Radiometer Chain Assembly
- REBA Radiometer Electronics Box Assembly
- S/C Spacecraft
- SCC Sorption Cooler Compressor assembly
- SCCE Sorption Cooler Cold End
- SCE Sorption Cooler Electronics
- SCOS Spacecraft Control and Operations System
- SCP Sorption Cooler Piping
- SCS Sorption Cooler Subsystem
- SS Stainless Steel
- SVM Service Module
- TCS Thermal Control System
- TM Telemetry
- TTC Telemetry, Tracking and Command
- WG Waveguide
References[edit]
<biblio force=false>
</biblio>
(Planck) Low Frequency Instrument
LFI warm electronics Back End Unit
High Electron Mobility Transistor
(Planck) High Frequency Instrument
LFI Radiometer Array Assembly
Sorption Cooler Subsystem (Planck)
LFI Radiometer Electronics Box Assembly
LFI cryogenic amplifying stage Front End Unit
Service Module
Sorption Cooler Compressor assembly
Focal Plane Unit
LFI warm electronics Back End Module
LFI Data Acquisition Electronics
revolutions per minute
LFI Radiometer Chain Assembly
LFI cryogenic amplifying stage Front End Module
LFI Ortho Module Transducer
analog to digital converter
Feed Horn
LFI Waveguide
Command and Data Management System
House Keeping
Signal Processing Unit
Data Processing Unit
Centre Spatial de Liège
[LFI meaning]: absolute calibration refers to the 0th order calibration for each channel, 1 single number, while the relative calibration refers to the component of the calibration that varies pointing period by pointing period.
System Level Test
Calibration and Performance Verification
Command and Data Management Unit
Data Processing Center
Field-Of-View
Junction Field Elect Transistor
Launch & Early Orbit Phase
Spacecraft
